
Highlight
Metal performance tracing adds the
metalperftracecommand-line tool and the StateReporting API. Together, they support hours-long performance data collection and analysis for game sessions, helping developers quickly identify the root causes of frame rate drops.
Core Ideas
Game optimization is an iterative process: test on different devices, collect data, analyze results, identify issues, fix them, and repeat. That sounds routine, but there is a practical pain point.
Players spend hours in a game, not just a few minutes. During those hours, conditions keep changing: the device heats up, thermal throttling kicks in, players adjust quality settings, levels change, and new scenes appear. Short tests can easily miss performance problems that only emerge during long play sessions.
The Metal Performance HUD can quickly show FPS, memory, frame interval, and other metrics, but its data is not saved. After several hours of play, it is hard to remember exactly when the frame rate dropped.
Apple’s answer is to let the system continuously record Metal performance data, including CPU, GPU, FPS, memory, and other metrics. The data can be stored for several days. After a game session ends, you can look back and collect the full performance record for those hours.
On macOS, you collect this data with the metalperftrace command-line tool. On iOS, you enable Performance Trace in Developer Settings, then collect it with a button in Control Center.
But collecting data is only the first step. If you see FPS drop to 26 at a specific moment, you still do not know what the game was doing at the time. Which level was active? What were the quality settings? What was the network state?
This is why context matters. Apple introduced the new StateReporting API so games can describe their behavior and state at any moment, then connect that state information to performance data.
Details
Metal Performance HUD basics
(00:29)
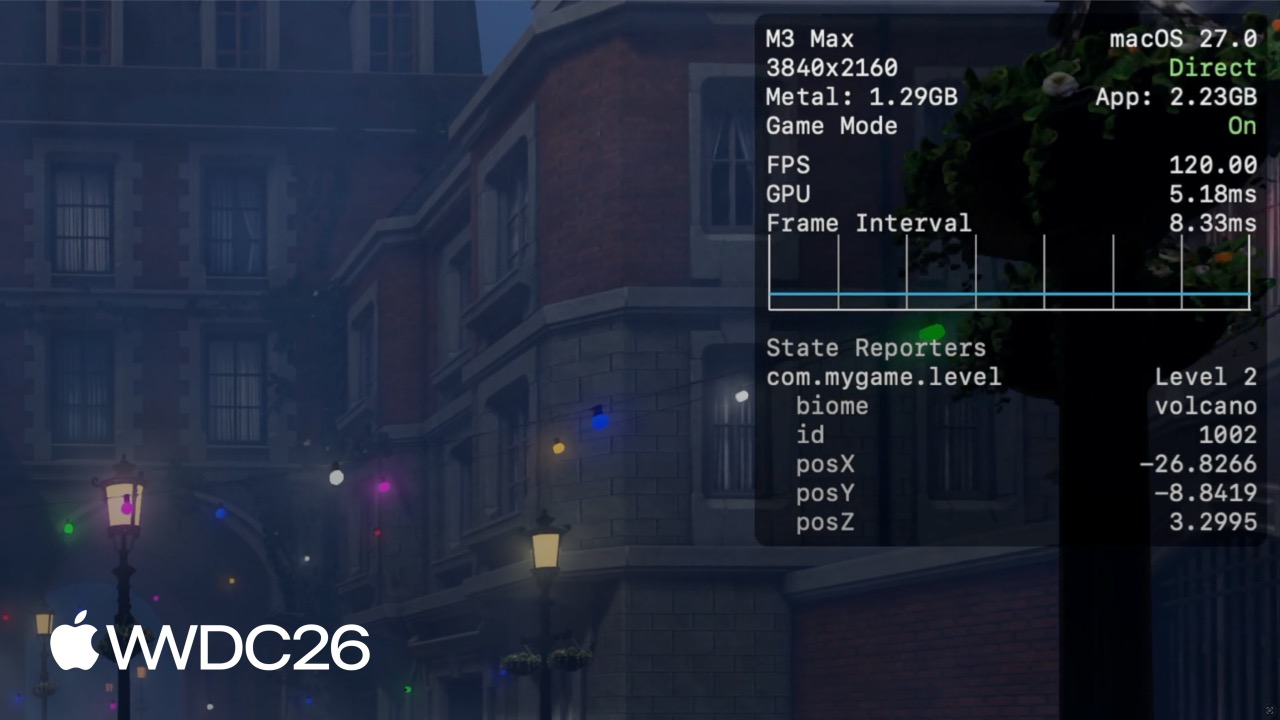
Metal Performance HUD overlays performance metrics above game content, including FPS, memory usage, and frame interval. It has a configuration panel for customizing displayed metrics, toggling each metric independently, and choosing presets.
The HUD is valuable for quickly checking performance trends during development, but it does not provide long-term storage.
Lookback performance data collection
(04:40)
The system continuously records Metal performance and resource usage data, including aggregate metrics and optional per-frame metrics for CPU, GPU, FPS, and memory. The data is stored efficiently and can be kept for days.
Collection on macOS
(05:00)
macOS 27 provides the new metalperftrace command-line tool:
# Collect data from the last 5 hours
metalperftrace collect /tmp --last 5h

# Output
# Metal performance traces collected to: /tmp
# /tmp/MetalPerfTrace_20260401_094100_to_144100.atrc

# Or specify an explicit time range
metalperftrace collect /tmp \
  --start 2026-04-01T09:41:00 \
  --end 2026-04-01T12:41:00
Key points:
collectis the subcommand, followed by the output directory.--lastsupports ranges from hours to days.- You can also use
--startand--endto specify an exact time range. - The output is a trace file in
.atrcformat.
Collection on iOS
(05:39)
iOS requires one-time device setup:
- Turn on Developer Mode and open Developer Settings.
- Enable Performance Trace.
- Choose Lookback Collection and set the lookback duration.
- Add the Performance Trace button to Control Center.
After setup, play the game normally. When the session ends, tap the Performance Trace button in Control Center. The device automatically collects and processes data for the selected time range. When processing finishes, you receive a notification, and the trace file appears in the available files list so it can be transferred to a Mac for analysis.
Analyzing trace data
(06:49)
Using metalperftrace overview
(07:02)
metalperftrace overview /Data/MyGameTrace.atrc

# [Modern Renderer pid:13833]
# Mem: 2146.1 MiB (2343.9 Peak, 1199.4 Metal)
# Total CPU Time: 2417.601s (33.17% Sys, 66.83% User)
# Instructions: 9944836683668 (5.75% P, 94.25% E)
# Cycles: 5176430469224 (4.45% P, 95.55% E)
# Disk Reads / Writes: 317.37 / 0.04 MiB (Logical Write 0.04)
# Layer 0x729293000 (3456x2104) Interval 300.065s Active 300.065s
#   59.7 FPS  17735 Frames  188 Skipped
#   Frame Time avg: 16.74ms min: 8.33 max: 125.00 stddev: 3.70
#   CPU Begin-to-Present avg: 3.99ms min: 1.40 max: 94.37 stddev: 1.80
#   On-GPU Time avg: 13.39ms min: 5.24 max: 37.57 stddev: 1.43
#   Next Drawable Wait avg: 0.26ms min: 0.00 max: 91.08 stddev: 1.75
#   Shader Compilation Time: 0.000s (Total: 0, Cached: 18)
Key points:
- The report has two parts: resource usage statistics for memory, CPU, and disk, and Metal performance metrics.
- Each layer shows FPS, frame count, and skipped frame count.
- Frame time includes average, minimum, maximum, and standard deviation.
- GPU time and CPU begin-to-present time are key metrics.
If the trace contains multiple processes, you can filter a specific process with a predicate or output structured data with --json for scripts.
JSON output
(07:58)
metalperftrace overview /Data/MyGameTrace.atrc --json --predicate 'process == "MyGame"'Key points:
--jsongenerates machine-readable structured output.- It can be used for regression testing or AI-based automatic performance analysis.
--predicatefilters a specific process.
Visualizing with Instruments
(08:29)
Instruments can open trace files for visual analysis. Data is plotted over time, and the system automatically evaluates and highlights outliers by marking metrics that deviate from the normal range in different colors.
You can select an interval on the timeline, and Instruments automatically aggregates statistics for that interval.
StateReporting API
(09:56)
To locate a performance problem, you need to know the game’s state at that moment. The StateReporting API lets you describe game behavior and state transitions.
Core concepts
(10:15)
- Domain: A finite state machine for a specific functional area, such as a level domain that tracks player progress.
- State: Each domain can be in only one state at a time.
- Label: The state’s name, such as “Level 1”.
- Stable Metadata: An immutable dictionary containing structured information about the state.
- Volatile Metadata: Values that can change within a state, such as player health.
Code example
(12:10)
#import <StateReporting/StateReporting.h>

// Create a domain and get its reporter
NSString *domain = @"com.mygame.level";
SRStateReporter *reporter = [SRStateReporter reporterForDomain:domain];

// Report a state transition
[reporter reportTransitionToStateLabel:@"Level 1"
                        stableMetadata:nil
                      volatileMetadata:nil];

// Transition with stable metadata
[reporter reportTransitionToStateLabel:@"Level 1"
                        stableMetadata:@{ @"id": @1001 }
                      volatileMetadata:nil];

// Update volatile metadata without changing state
[reporter reportVolatileMetadataUpdate:@{ @"health": @100 }];
Key points:
- Domain names usually use reverse-DNS strings.
reporterForDomain:gets the state reporter for a domain.reportTransitionToStateLabelreports a state transition.stableMetadatacontains immutable information about the state.reportVolatileMetadataUpdateupdates volatile data without changing state.
StateReporting and tool integration
Metal Performance HUD integration
(13:00)
State domains appear in the metric configuration tab in Metal Performance HUD. Once enabled, the overlay shows labels, stable metadata, and volatile metadata.
metalperftrace integration
(13:42)
When a trace contains state transitions, metalperftrace overview displays the domain list, transition count, and last known state.
# Show full state transitions
metalperftrace overview /Data/MyGameTrace.atrc --include-state-transitions

# [States]
# com.mygame.graphics
#   High (30.59%, 14.996s)  raytracing: 1  shadow: ultra
#   Medium (69.38%, 34.012s)  raytracing: 0  shadow: medium
# com.mygame.level
#   Level 1 (20.47%, 10.033s)  biome: forest   id: 1001
#   Level 2 (79.53%, 38.991s)  biome: volcano  id: 1002
Key points:
--include-state-transitionsprints the full state list and timestamps.- It shows the duration and percentage for each state.
- Stable metadata is included.
Aggregating metrics by state
(14:15)
# Aggregate all domains
metalperftrace overview /Data/MyGameTrace.atrc --aggregate

# Aggregate a specific domain
metalperftrace overview /Data/MyGameTrace.atrc --aggregate \
  --domain com.mygame.graphics

# Aggregate a specific state label
metalperftrace overview /Data/MyGameTrace.atrc --aggregate \
  --domain com.mygame.graphics \
  --state-label "High"
Key points:
--aggregateautomatically aggregates metrics by state.- You can specify a domain or a specific state label.
- The report shows active duration and overlapping states.
Instruments integration
(15:02)
Instruments creates a track for each domain as part of the Points of Interest instrument. Each track plots state transitions and volatile updates, making context easier to understand.
Select a single state to view details, including stable and volatile metadata, in the sidebar.
Best practices
(16:17)
- Design domains and states carefully: Each domain should be conceptually orthogonal. Do not represent too many dimensions in one domain.
- Limit state transition frequency: StateReporting is for analyzing long-running performance, not high-frequency state changes. Transition frequency should stay at user-action speed or slower.
- Validate state correctness: Use Metal Performance HUD and Instruments to confirm transitions behave as expected and to check edge cases.
Post-release monitoring: MetricKit
(17:54)
MetricKit provides two types of data: metrics and diagnostics. It continuously collects data in the background and delivers reports to the game process each day.
In macOS and iOS 27, MetricKit adds Metal frame rate information as well as frame rate data aggregated by StateReporting state.
Reports include the overall average frame rate, time, and frame count, and can also group frame rate information by states in a level domain.
Deeper analysis tools
(15:44)
With enough context, use these tools for deeper analysis:
- Metal System Trace template in Instruments: captures detailed CPU and GPU scheduling data.
- Metal Debugger in Xcode: captures and profiles a single frame.
Key Takeaways
-
Level-loading performance analyzer: Use StateReporting to report level state and loading phases, then use
metalperftraceto analyze frame rate patterns for each level. Identify which levels have performance problems and whether they are tied to specific scene elements. -
Graphics quality recommendation system: Track the relationship between graphics settings, such as shadow quality and ray tracing, and frame rate. Use
--aggregateto aggregate metrics by state, identify which setting combinations cause frame drops, and recommend the best configuration for each device. -
Player behavior heat map: Use volatile metadata to track player position, combat state, and similar context, then analyze which areas or activities cause performance drops. Combine that with MetricKit field data to find performance hotspots encountered broadly by players.
-
Automated performance regression tests: Integrate
metalperftraceJSON output into CI/CD to automatically detect abnormal frame rate or memory changes in new versions. Use an AI agent to analyze the JSON data and flag potential issues. -
Thermal throttling warnings: Track device and thermal state, and correlate frame rate drops with thermal throttling events. Understand how the game behaves in different thermal states and optimize performance under heat.
Related Sessions
- Enhance your game performance with Metal — Metal rendering performance optimization techniques
- Metal debugging and profiling update — The latest updates to Metal developer tools
- Optimize your game with Instruments — Best practices for performance analysis with Instruments
- Meet the new MetricKit — A deep dive into MetricKit
- Diagnostics and crash analysis — App diagnostics and crash analysis
Comments
GitHub Issues · utterances