
Highlight
Instruments 27 introduces the Top Functions view, Run Comparison, and the Swift Executors instrument. Together with OSSignpost markers for business intervals, they give developers a concrete workflow for diagnosing CPU saturation, executor contention, and system blocking.
Core Ideas
Three responsiveness problems in a notes app
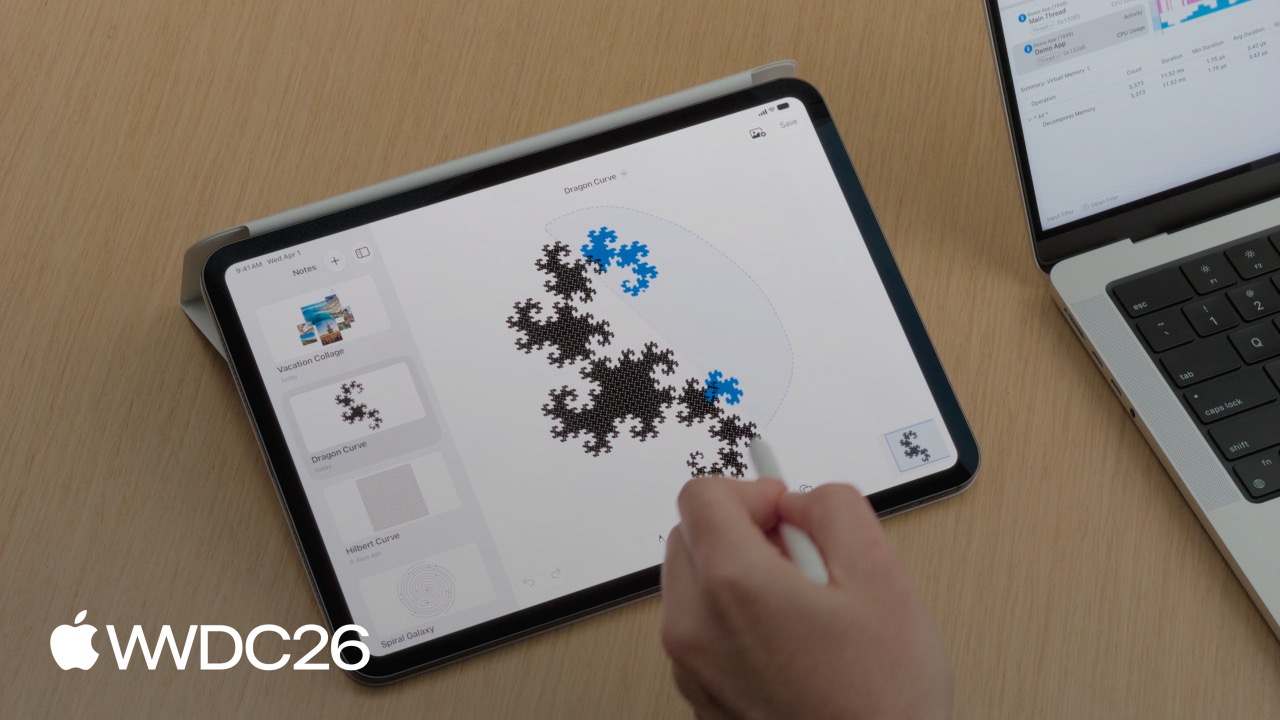
The presenter used a real notes app as the case study. The app supports drawing, inserting images, and moving content with a lasso tool. During testing, three issues appeared: Apple Pencil response lag after saving a note, dropped frames while scrolling the note list, and a lasso tool that froze.
These three issues map to three different performance root causes, and each requires a different diagnostic approach.
The diagnostic mental model
(01:46)
Instruments 27 frames diagnosis as a four-step process:
- CPU saturation — main-thread CPU climbs to 100%, which means the code itself is running too slowly
- Sample-data visualization — use Call Tree, Flame Graph, or Top Functions to find the expensive function
- Executor contention — multiple tasks compete for Main Actor resources
- System blocking — the CPU is idle but the app is suspended because the main thread is waiting on file I/O, a synchronous lock, or IPC
The first step is always Time Profiler. Look at main-thread CPU usage during the hang. If it is high, you have an algorithm problem. If it is low, you have a blocking problem. That distinction determines which tool to use next.
Problem 1: the lasso tool freezes because of existential runtime cost
(05:37)
The presenter first wrapped the lasso-selection logic in an OSSignpost interval:
import os.signpost

let signposter = OSSignposter(subsystem: "Demo App", category: .pointsOfInterest)
var lassoIntervalState: OSSignpostIntervalState? = nil

func lassoSelectionUpdated() {
    lassoIntervalState = signposter.beginInterval("Lasso Selection")
    // Update the selection in the canvas...
}

func lassoSelectionEnded() {
    // Finalize the lasso selection...
    signposter.endInterval("Lasso Selection", lassoIntervalState!)
}
Key points:
- Set the
OSSignpostersubsystemto the app name andcategoryto.pointsOfInterest, and Instruments displays it automatically in the Points of Interest track beginIntervalandendIntervalmust be called in pairs, otherwise the interval extends to the end of the trace- The context menu can filter directly to the time range for that interval
After filtering, main-thread CPU was close to 100%, which meant the code was simply too slow. In Time Profiler’s Top Functions view, the most expensive function was swift_project_boxed_opaque_existential.
That runtime function projects an existential value, such as a value of type any Foo. Because the concrete type of an existential is unknown at compile time, the runtime has to perform extra memory-layout and dynamic-dispatch work.
(12:11)
The presenter showed three alternatives:
// Option 1: concrete types with direct overloads
func bar(_ a: TypeA) { }
func bar(_ b: TypeB) { }

// Option 2: generics, so the type is known at compile time
func bar<T: Foo>(_ generic: T) { }

// Option 3: enum, replacing the protocol with associated values
enum Foo {
    case a(TypeA)
    case b(TypeB)
}
func bar(_ enum: Foo) { }
Key points:
any Foo(an existential) needs dynamic projection at runtime, producing calls toswift_project_boxed_opaque_existential- Concrete types and generics let the compiler know the type at compile time and eliminate dynamic dispatch
- An enum with associated values works well when the set of possible types is fixed and enumerable
Run Comparison: verify the fix
(13:30)
Instruments 27 adds Run Comparison. Put before-and-after traces in the same document and compare them. Green means improvement, red means regression.
The comparison showed that calls to swift_project_boxed_opaque_existential were completely eliminated and total execution time dropped. The newly introduced generic function was marked as a regression, but the overall win was larger than the added cost.
Problem 2: scrolling drops frames because thumbnail rendering monopolizes the Main Actor
(16:32)
The Swift Executors instrument is new in Instruments 27. It visualizes work running on the Main Actor, the global concurrent executor, and custom executors.
On the Main Actor track, the presenter found multiple renderThumbnail tasks, each taking hundreds of milliseconds. These tasks were launched from SwiftUI and implicitly inherited the Main Actor context, blocking UI updates.
(18:29)
The fix is to add @concurrent to the Task closure:
let drawingData = note.drawingData
let canvasImages = note.decodeCanvas()

thumbnail = await Task(name: "Render Thumbnail") { @concurrent in
    await renderThumbnail(
        drawingData: drawingData,
        canvasImages: canvasImages,
        size: CGSize(width: 300, height: 240)
    )
}.value
Key points:
Task { }inherits the caller’s actor context by default, so a task launched from SwiftUI stays on the Main Actor@concurrentexplicitly routes the task to the global concurrent executor, freeing the Main Actor- The Swift compiler checks for data races inside the
@concurrentclosure - After moving off the Main Actor, multiple thumbnail renders can run in parallel
Problem 3: saving freezes because synchronous file I/O blocks the main thread
(19:25)
Saving a note briefly suspended the UI. Time Profiler showed main-thread CPU at only about 20%, which is the classic signature of system blocking.
Switching to System Trace, the Inspector panel showed that the main thread was executing a write system call and trying to write 1.7 GB of data. The operation took more than 500 milliseconds, with nearly 300 milliseconds spent waiting for disk response.
(24:25)
The fix is to move the file write to a background task:
Task { @concurrent in
    let encoder = PropertyListEncoder()
    encoder.outputFormat = .binary
    guard let data = try? encoder.encode(snapshots) else { return }
    let id = signposter.beginInterval("Writing To File")
    try? data.write(to: fileURL, options: .atomic)
    signposter.endInterval("Writing To File", id)
}
Key points:
Data.write(to:options: .atomic)is synchronous and blocks the current thread until disk work completes- The
.atomicoption first writes a temporary file and then renames it, adding I/O overhead - Wrapping both encoding and writing in an
@concurrenttask lets the main thread return immediately and keeps the UI responsive - During verification, System Trace should show the
writesyscall moved from the main thread to a background thread
Details
Mark business intervals with OSSignpost
(04:50)
The first step in locating hangs in Instruments is to mark key business paths with time intervals. OSSignposter displays custom intervals in the Points of Interest track, making later filtering and comparisons easier.
import os.signpost

let signposter = OSSignposter(
    subsystem: "com.example.NotebookApp",
    category: .pointsOfInterest
)

class CanvasViewController {
    var lassoIntervalState: OSSignpostIntervalState?

    func lassoSelectionUpdated() {
        lassoIntervalState = signposter.beginInterval("Lasso Selection")
        // Iterate over every stroke and check whether it intersects the lasso path
        for stroke in allStrokes {
            if lassoPath.intersects(stroke.boundingRect) {
                selectedStrokes.insert(stroke)
            }
        }
    }

    func lassoSelectionEnded() {
        // Finish the lasso selection and highlight the selected strokes
        highlightSelectedStrokes()
        signposter.endInterval("Lasso Selection", lassoIntervalState!)
    }
}
Key points:
- Use reverse-DNS format for the
OSSignpostersubsystem, such ascom.example.NotebookApp, and setcategoryto.pointsOfInterestso Instruments automatically renders colored interval bars in the Points of Interest track - Store the
OSSignpostIntervalStatereturned bybeginIntervalin an instance variable soendIntervalcan close the correct interval; if calls are not paired, the interval extends to the end of the trace - In Instruments, right-click an interval in the Points of Interest track and choose “Set Inspection Range” to analyze only the samples in that time window and remove unrelated noise
Use @concurrent to move thumbnail rendering off the Main Actor
(18:29)
A Task { } launched from a SwiftUI view inherits the caller’s actor context by default. If the caller is on the Main Actor, such as a @MainActor ViewModel or a view body, the task also runs on the Main Actor and blocks UI updates.
// Problematic code: Task implicitly inherits the Main Actor and causes dropped frames while scrolling
func updateThumbnail() async {
    let drawingData = note.drawingData
    let canvasImages = note.decodeCanvas()

    // Wrong: without @concurrent, the task stays on the Main Actor
    thumbnail = await Task(name: "Render Thumbnail") {
        await renderThumbnail(
            drawingData: drawingData,
            canvasImages: canvasImages,
            size: CGSize(width: 300, height: 240)
        )
    }.value
}

// Fixed code: @concurrent routes the task to the global concurrent executor
func updateThumbnailFixed() async {
    let drawingData = note.drawingData
    let canvasImages = note.decodeCanvas()

    thumbnail = await Task(name: "Render Thumbnail") { @concurrent in
        await renderThumbnail(
            drawingData: drawingData,
            canvasImages: canvasImages,
            size: CGSize(width: 300, height: 240)
        )
    }.value
}
Key points:
Task { }inherits the caller’s actor context by default, so tasks launched from SwiftUI stay on the Main Actor; in the Swift Executors instrument, the Main Actor track shows multiple serialrenderThumbnailtasks@concurrentexplicitly routes the task to the global concurrent executor and frees the Main Actor; multiple thumbnail renders can run in parallel and UI updates are no longer blockeddrawingDataandcanvasImagescaptured before the closure are value types (Dataand[UIImage]), so value capture does not introduce a data race; the Swift compiler checks for cross-actor data races in@concurrentclosures- Verification: in the Swift Executors instrument, check that
renderThumbnailtasks disappear from the Main Actor track and appear on the Global Concurrent Executor track
Move synchronous file I/O to a background thread
(24:25)
If saving a note directly calls Data.write(to:options:), the current thread is blocked until disk work finishes. For a large file, such as the 1.7 GB note data in this example, that can suspend the main thread for hundreds of milliseconds.
// Problematic code: synchronous writing blocks the main thread
func saveNote() {
    let encoder = PropertyListEncoder()
    encoder.outputFormat = .binary
    guard let data = try? encoder.encode(snapshots) else { return }
    // Blocking: the main thread waits for the write syscall to return
    try? data.write(to: fileURL, options: .atomic)
}

// Fixed code: move both encoding and writing into an @concurrent Task
func saveNoteFixed() {
    Task { @concurrent in
        let encoder = PropertyListEncoder()
        encoder.outputFormat = .binary
        guard let data = try? encoder.encode(snapshots) else { return }

        let id = signposter.beginInterval("Writing To File")
        try? data.write(to: fileURL, options: .atomic)
        signposter.endInterval("Writing To File", id)
    }
}
Key points:
Data.write(to:options: .atomic)is synchronous, and.atomicfirst writes a temporary file and then performs arenamesystem call, adding extra I/O overhead- After encoding and writing are wrapped in an
@concurrenttask, the main thread returns immediately after creatingTask { }, keeping the UI responsive; the actual I/O runs on a background thread - Verify in System Trace: select the main thread’s Blocked interval, and the Inspector panel should no longer show a
writesyscall; the background thread’s Running interval should contain thewritecall, with arguments showing the file path and data size - If the save operation needs to report success or failure to the UI, combine
Task { @concurrent in ... }withawaitor useTask.detachedplus a callback, but do not directly mutate@MainActor-isolated state inside the@concurrentclosure
Time Profiler’s three views
(07:23)
Time Profiler samples every CPU core’s call stack with a hardware timer at 1 millisecond intervals. When the same function appears through different call paths, Call Tree shows it in multiple places.
Flame Graph maps the call tree into spatial blocks. The vertical axis is call-stack depth, and the horizontal axis is total CPU time. Wide blocks represent frequently appearing functions, making hot paths easy to spot.
But Flame Graph is not friendly to Swift runtime functions such as swift_retain. Those functions are scattered into small blocks across many call sites, making total cost hard to judge.
Top Functions solves that problem. It discards the call hierarchy and merges scattered nodes by self weight, the time spent executing the function’s own instructions. The left side lists sorted functions, and the right side shows all call-path Flame Graphs for the selected function.
System Trace and thread states
(20:37)
System Trace visualizes when and why the operating system pauses your app. Threads have three states:
- Running: actively executing on a CPU core
- Blocked: waiting for a resource and removed from the CPU by the kernel
- Runnable: the resource is ready, and the thread is waiting for the OS scheduler to assign a CPU core
The Inspector panel displays syscall arguments: file descriptors, memory addresses, and data sizes. When a syscall interval is selected, the solid section represents on-core execution time, and the translucent section represents off-core blocked time.
Key configuration reminders
(03:24)
- Always profile with Release builds. Debug builds disable compiler optimizations and insert many runtime checks, which can mislead your diagnosis
- The Swift Concurrency template includes Time Profiler, so you can observe both concurrency tasks and CPU samples at once
- OSSignpost interval markers make Run Comparison more precise and reduce noise
Key Takeaways
1. Add OSSignpost intervals to critical business paths
What to do: Wrap beginInterval/endInterval around important paths such as network requests, database queries, complex rendering, and file reads or writes.
Why it is worth doing: An unmarked trace is hard to interpret. With markers, you can filter directly to business intervals and use Run Comparison to precisely measure each optimization.
How to start: Initialize an OSSignposter when the app starts, call beginInterval at the start of important functions, and call endInterval at the exit.
2. Audit any protocol types in your code
What to do: Scan frequently called functions for any SomeProtocol parameters. In performance-sensitive paths such as rendering, animation, and gesture handling, replace them with concrete types, generics, or enum associated values.
Why it is worth doing: Runtime costs like swift_project_boxed_opaque_existential are not obvious in one call, but they accumulate into visible hangs inside high-frequency loops.
How to start: Run the app’s core interaction path in Instruments’ Top Functions view and check whether Swift runtime functions appear near the top.
3. Use @concurrent to move compute work off the Main Actor
What to do: Inspect every Task { } closure triggered from SwiftUI. If the closure contains expensive work such as image decoding, data serialization, or complex layout computation, add @concurrent.
Why it is worth doing: Swift Concurrency’s implicit actor inheritance makes Main Actor blocking easy to miss. The Swift Executors instrument visualizes the issue, and @concurrent is the standard fix.
How to start: Search for Task { in Xcode, especially instances without @concurrent, and review closure contents one by one.
4. Build a system-blocking checklist
What to do: When an app hangs but Time Profiler shows low CPU, switch to System Trace and check in this order: file I/O (write/read syscalls), synchronous locks (pthread_mutex_lock), and IPC (XPC / mach_msg).
Why it is worth doing: Time Profiler cannot expose these issues, but System Trace plus the Inspector panel can identify the exact syscall and arguments.
How to start: Choose the System Trace template in Instruments, reproduce the hang, and inspect syscall details for Blocked intervals in the Inspector.
5. Include Run Comparison in code review for performance work
What to do: Attach before-and-after Instruments Run Comparison screenshots to every performance optimization PR.
Why it is worth doing: Performance work can easily introduce regressions. Run Comparison’s green/red visualization makes the effect of the change obvious and helps teammates understand its impact.
How to start: Open two traces in Instruments, click the compare button, choose the baseline run, and export a flame graph screenshot.
Related Sessions
- 243 - What’s new in Instruments — A broad overview of new features in Instruments 27
- 267 - What’s new in Swift Testing — Combining Swift Testing with performance tests
- 262 - What’s new in Swift — New Swift language features, including the evolution of generics and existentials
- 258 - What’s new in Xcode 27 — Coding Assistant and performance-analysis workflows in Xcode 27
- 259 - Accelerate development with agents in Xcode 27 — The Coding Assistant mentioned in this session can automatically refactor existential-heavy code
Comments
GitHub Issues · utterances