
Highlight
Swift performance intuition isn’t as direct as C. Translation from C to machine code is almost literal—local variables on the stack, heap allocation only when you explicitly call malloc. Swift introduces safety and many abstraction tools (closures, generics, etc.), and their implementation costs aren’t as visible as malloc.
Core Content
When writing C, you have natural performance intuition: local variables on the stack, malloc as the only heap allocation point, and compiler work maps almost one-to-one to machine code. Swift breaks this intuition—safety requirements introduce implicit checks, and implementation costs of abstractions like generics, closures, and protocols are scattered everywhere, not as visible as malloc.
John McCall summarizes low-level performance concerns into four dimensions: function call overhead, data representation efficiency, memory allocation cost, and value copy/destruction cost. Every Swift feature affects one or two of these to some degree. The good news is the Swift optimizer is strong and eliminates much abstraction overhead you don’t see; the bad news is the optimizer has limits, and how you write code directly determines how much it can do.
This leads to practical advice: when performance matters to your project, monitor it regularly. After locating hotspots in a top-down investigation, find ways to measure them, then automate those measurements into your development workflow. Whether you break optimizer assumptions or accidentally introduce quadratic algorithms, automated regression tests catch regressions in time.
Detailed Content
Four costs of function calls
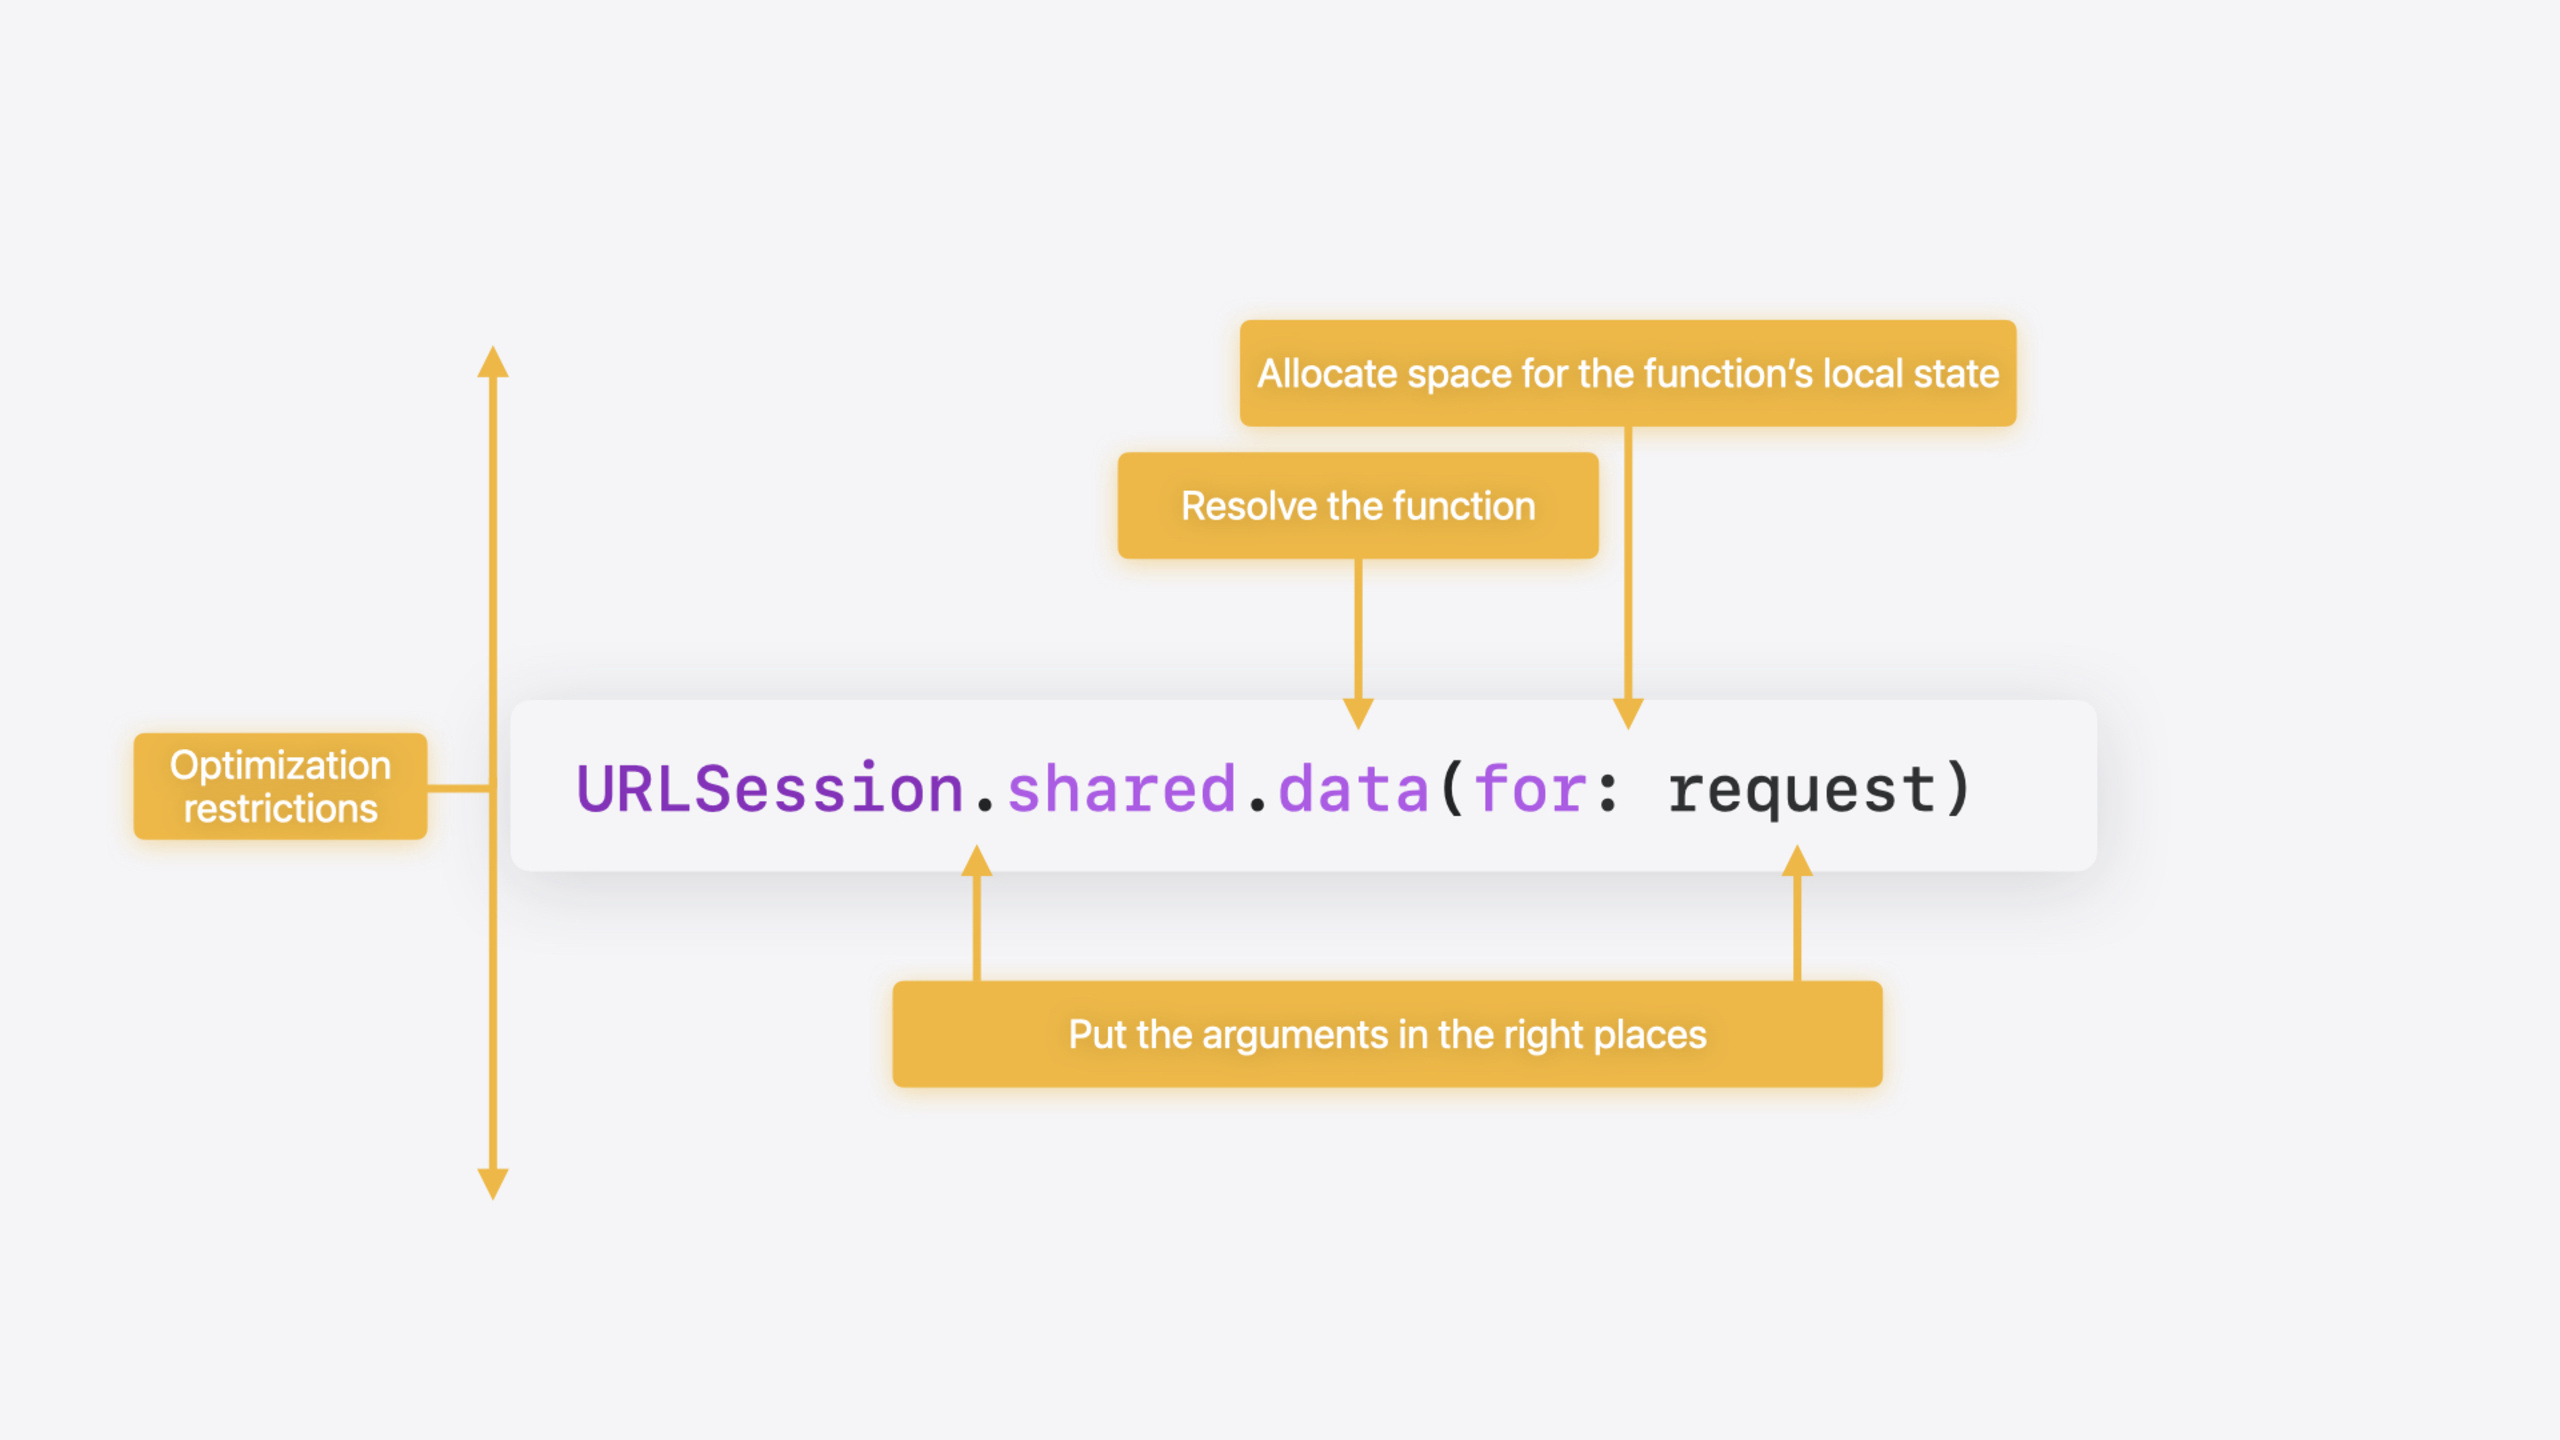
Function calls have four overheads: setting up parameters, resolving the function address, allocating local state space, and hindering optimization. The first three are what you do; the fourth is what you therefore cannot do (04:39).
Parameter passing has two layers: at the low level, register moves per calling convention—modern processors mostly hide this; at the high level, ownership conventions may cause extra retain/release, which often shows up in profiles.
Static dispatch vs dynamic dispatch is the key divide. Static dispatch lets the compiler see function definitions for inlining and generic specialization; dynamic dispatch supports polymorphism but sacrifices optimization opportunities. In Swift, protocol requirements use dynamic dispatch; protocol extension methods use static dispatch (06:40):
protocol DataModel {
    func update(from source: DataSource)
}

extension DataModel {
    func update(from source: DataSource) {
        self.update(from: source, quickly: true)
    }
}update(from:)declared in theprotocol DataModelbody is a requirement—calls use dynamic dispatchupdate(from:)declared inextension DataModelis an extension method—calls use static dispatch- Different semantics: requirements follow dynamic polymorphism; extension methods are based on compile-time known types
- Prefer extension methods on performance-critical paths, but understand the semantic change
Memory allocation: global, stack, and heap sources
Global memory is allocated at program load—nearly free, but only for fixed-size data whose lifetime spans the entire program. Stack allocation moves the stack pointer—equally fast, but requires memory to have a clear lifetime endpoint within the current function scope. Heap allocation is most flexible and has the highest allocation/deallocation cost (08:29).
A function’s CallFrame is allocated on the stack. The compiler must subtract the stack pointer once to save the return address anyway; subtracting a few more bytes costs no extra time, so local variables in the CallFrame are nearly free (07:18):
_$s4main9updateAll6models4fromySayAA9DataModel_pG_AA0F6SourceCtF:
    sub   sp, sp, #208
    stp   x29, x30, [sp, #192]
    …
    ldp   x29, x30, [sp, 192]
    add   sp, sp, #208
    ret
sub sp, sp, #208: on function entry, stack pointer subtracts 208 bytes, allocating the CallFramestp x29, x30, [sp, #192]: save frame pointer and return addressadd sp, sp, #208: on function exit, stack pointer adds back 208 bytes, releasing the CallFrame- These 208 bytes cover all local state, including
models,source,model, iterators, etc.
Value copying and ownership
Swift’s ownership system is core to memory safety. Values interact in three ways: consume (transfer ownership), mutate (temporarily take ownership then return), borrow (read-only loan that prevents others from modifying or destroying) (15:00).
Copying a value means copying its inline representation. Copying a struct recursively copies all stored properties; copying a class retains the reference. Large struct copy cost comes from two sources: reference-type properties need individual retains, and each copy needs independent storage. The consume operator explicitly requests copy-free transfer (16:27):
func makeArray() {
    var array = [ 1.0, 2.0 ]
    var array2 = consume array
}
var array = [1.0, 2.0]: initialization; literal produces an independent value, ownership transferred directly, no copyvar array2 = consume array: explicitly consumearray, transfer ownership toarray2, zero copy- Accessing
arrayafterconsumetriggers a compile error because the value was transferred - The compiler usually auto-applies this optimization when it can prove no subsequent use;
consumegives you manual control
When passing parameters, Swift must prove no concurrent mutate or consume to borrow instead of copy. Class property storage makes this proof harder and may cause defensive copies (18:10):
func makeArray(object: MyClass) {
    object.array = [ 1.0, 2.0 ]
    print(object.array)
}object.arraystorage is in the class instance; Swift can’t easily prove the property isn’t modified duringprint- The compiler may insert defensive copies (retain buffer) to ensure
printreads a stable value - Swift is actively improving this area, including optimizer enhancements and explicit
borrowfeatures
Closures: non-escaping vs escaping
Function values in Swift are always a pair: function pointer + context pointer. Non-escaping closure context can be allocated on the stack because the closure isn’t used after the call returns (28:47):
func sumTwice(f: () -> Int) -> Int {
  return f() + f()
}

func puzzle(n: Int) -> Int {
  return sumTwice { n + 1 }
}sumTwiceaccepts a non-escaping functionf- Closure
{ n + 1 }capturesn; the compiler generates a stack context struct holdingn - When calling
f(), the context pointer is passed as an implicit parameter—no heap allocation - If
nisvarand modified by the closure, non-escaping closures only capture a pointer to the variable—the variable itself doesn’t need heap allocation
Escaping closures differ: context must be heap-allocated and reference-counted—essentially an anonymous class instance. var captured by escaping closures is also heap-allocated because the closure may extend the variable’s lifetime (29:34).
Generics vs protocol types (some vs any)
Generic functions and protocol-type functions look similar but have very different runtime characteristics (31:50):
func updateAll<Model: DataModel>(models: [Model],
                            from source: DataSource) {
    for model in models {
        model.update(from: source)
    }
}

func updateAll(models: [any DataModel], from source: DataSource) {
    for model in models {
        model.update(from: source)
    }
}- First (generic): array elements are homogeneous, compactly laid out in memory; type info and witness table passed once as top-level parameters; can specialize when caller knows the concrete type (32:57)
- Second (
any): array elements can be heterogeneous; each element carries its own type info and witness table; inline storage is only 3 pointer sizes, heap-allocated if exceeded; specialization is extremely difficult any DataModelinline representation includes value storage (3 pointers), type metadata pointer, witness table pointer
The optimizer can specialize generic functions—when the caller passes a known type [MyDataModel], the compiler generates a specialized version handling only that type, eliminating all abstraction overhead.
Memory model of async functions
Async function local state can’t live on the C stack because the thread may be released during suspension. Swift’s approach allocates an independent slab stack for each async task (25:02). Async functions are split into multiple partial functions; each partial function runs on the C stack until the next suspension point, then tail-calls the next partial function. On suspension it returns immediately and the thread is reused.
Core Takeaways
-
What to do: Use
someinstead ofanyfor generic constraints- Why it’s worth it:
somepreserves concrete type info so the compiler can specialize and inline;anyintroduces existential containers where each element carries 3 pointers + metadata + witness table, and values exceeding 3 pointers trigger heap allocation - How to start: Check function parameters for
[any Protocol]; if elements are always homogeneous, change to<T: Protocol>or[some Protocol]
- Why it’s worth it:
-
What to do: Distinguish protocol requirements from extension methods
- Why it’s worth it: requirements use dynamic dispatch—the compiler can’t inline; extension methods use static dispatch and can be inlined and specialized. Significant difference on performance-critical paths
- How to start: Review protocol method calls on hot paths; move performance-critical calls from requirements to extensions, or change the protocol to a generic constraint
-
What to do: Avoid passing class properties directly as parameters, or explicitly annotate with
borrow- Why it’s worth it: class property storage makes it hard for the compiler to prove no concurrent modification, possibly inserting defensive copies (extra retain/release). Swift is improving, but attention is still needed
- How to start: Check retain/release counts on hot paths in Instruments; when abnormally many copies appear, use local variables as intermediates or explicit
borrow
-
What to do: Automate performance regression tests
- Why it’s worth it: The optimizer is strong but not omnipotent; code style changes can quietly break optimizer assumptions. Manual checks are unreliable—only automation catches regressions on every commit
- How to start: After locating hotspots in Instruments, write XCTest performance tests measuring those hotspots and integrate into CI
Related Sessions
- Analyze heap memory — Deep heap memory allocation analysis with Instruments to locate leaks and over-allocation
- Consume noncopyable types in Swift — How noncopyable types use the ownership system to eliminate unnecessary copies
- Explore the Swift on Server ecosystem — Performance considerations and ecosystem tools for Swift on the server
- Go further with Swift Testing — Write automated test suites including performance tests with the Swift Testing framework
Comments
GitHub Issues · utterances