
Highlight
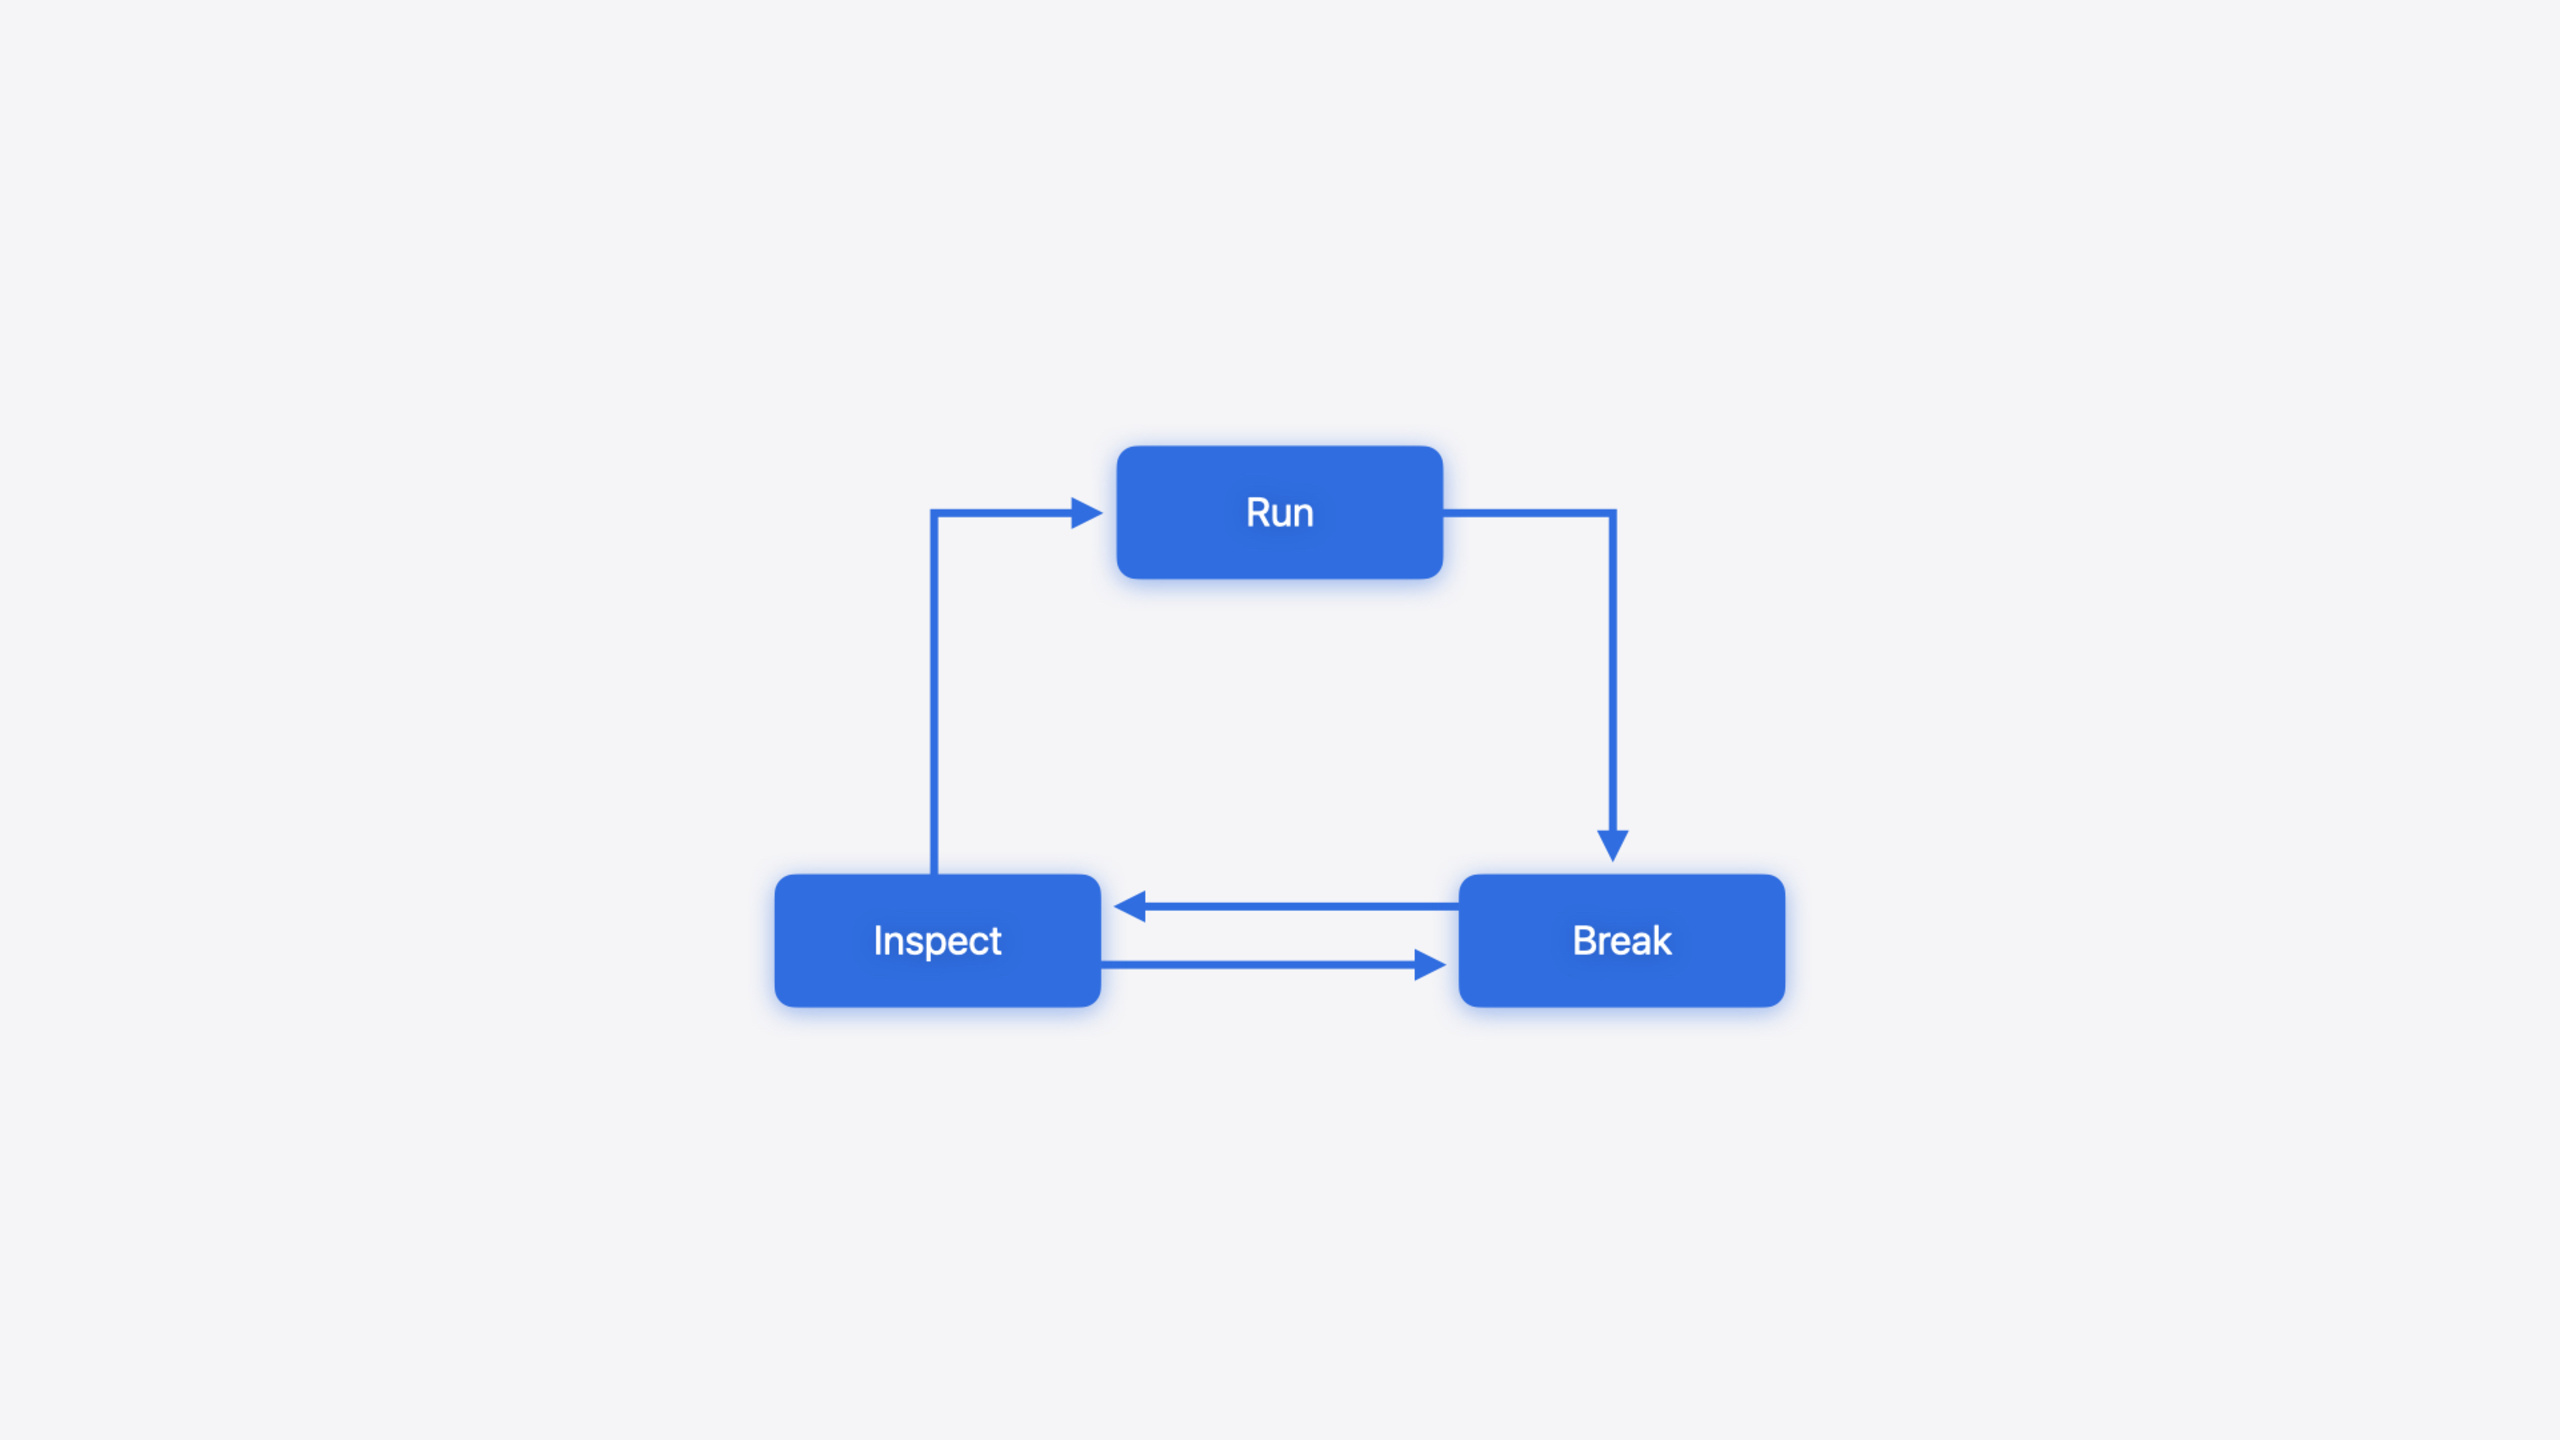
LLDB models debugging as a Run → Break → Inspect loop: after each pause, inspect state, then continue or re-run based on what you learn—narrowing the problem until you find the bug.
Core Content
Print debugging is what most people learn first: insert print statements, recompile, run, read output, repeat if unsatisfied. Three problems—every print change needs a recompile; prints linger in production; and you can only inspect what you thought to print ahead of time. LLDB offers a better path: set breakpoints at runtime, inspect variables, evaluate expressions—all without recompiling.
This session frames debugging as a search problem. Wrong behavior appears at some point; the bug lives somewhere between launch and that moment. Your goal is to find that code. Inspect program state at different times; each inspection moves you closer. LLDB provides four core tools: backtrace, variable inspection, breakpoints, and expression evaluation.
Using the multi-platform Destination Video app, the session walks a real scenario: adding “Watch Later,” understanding SwiftUI closure timing, fixing JSON decode errors, and customizing how custom types appear in the debugger. Each maps to a core LLDB capability.
Detailed Content
Offline crashlog analysis
When a program crashes, Apple platforms collect state at crash time into a crashlog. LLDB can consume crashlogs to simulate a debug session—locate issues without running the program (04:37).
In Xcode, right-click a crashlog and open with Xcode linked to the matching project. Xcode creates an LLDB session and highlights the crash line. Backtrace shows the full call chain: current frame is JSON loading, parent frame imports video metadata, above that is initialization. Sometimes one crashlog is enough to find the bug.
Prerequisites: checkout the project at the same commit as the crashlog, and have the matching dSYM bundle.
One SwiftUI line breakpoint resolves to multiple locations
A line breakpoint on a SwiftUI Button initializer resolves to multiple independent locations (08:29):
Button(action: { watchLater.toggle(video: video) }) {
  let inList = watchLater.isInList(video: video)
  Label(inList ? "In Watch Later" : "Add to Watch Later",
  systemImage: inList ? "checkmark" : "plus")
}
Key points:
- LLDB resolves this line to 3 breakpoint locations: 1.1, 1.2, 1.3
- 1.1 is the
Buttoninitializer call site—fires when UI is created - 1.2 is the action closure (
watchLater.toggle(video: video))—fires only on tap - 1.3 is the trailing closure (label)—called by the initializer itself
- Common in declarative frameworks like SwiftUI: same line, different code paths
breakpoint listshows line and column for each location- Each location can be enabled or disabled independently
Breakpoint actions and command-line control
In the Break/Inspect loop, repeating the same commands manually is tedious. Breakpoint actions run commands automatically on hit (13:17):
p "last video is \(watchLater.last?.name)"In Xcode: right-click breakpoint → Edit Breakpoint → add Debugger Command action; check “Continue after evaluation” to auto-continue.
Same from the command line (14:42):
b DetailView.swift:70
break command add
p "last video is \(watchLater.last?.name)"
continue
DONE
Key points:
bis shorthand forbreakpoint setbreak command addattaches actions to the most recent breakpoint; typeDONEto finish- Command-line actions override Xcode-configured actions
helpandapropossearch all LLDB commands
Conditional breakpoints and high-frequency hits
When a breakpoint fires too often in a loop, three filters help (16:09):
- Conditional breakpoint:
break modify --conditionwith a Boolean expression, e.g.video.duration > 60 - Temporary breakpoint (tbreak): create a one-shot breakpoint inside an action—for “stop only after A reaches B”
- Ignore count:
break modify --ignore-count 10skips the first N hits
When a line runs millions of times, LLDB still pauses each time to evaluate conditions, slowing execution. Add an if in code that calls raise(SIGSTOP) inside to hand control to the debugger.
p command and expression evaluation
From Xcode 15, p is redefined as a “do what I mean” print alias covering most variable inspection and expression evaluation (19:57).
When debugging JSON decode errors, build complex expressions step by step with p (24:06):
p watchLater.count
p watchLater.last!.name
Key points:
pevaluates expressions in any backtrace frame- Build expressions incrementally; see intermediate results without recompiling
- Variables also appear in Xcode’s variable viewer or source hover
- Some types (URL, Image) have Quick Look for extra visualization
- Swift Error breakpoint pauses automatically when Swift errors are thrown
@DebugDescription macro
Swift 6 adds @DebugDescription so custom types show readable summaries in the debugger (26:46):
@DebugDescription
struct WatchLaterItem {
    let video: Video
    let name: String
    let addedOn: Date

    var debugDescription: String {
        "\(name) - \(addedOn)"
    }
}
Key points:
- Annotate with
@DebugDescriptionand provide adebugDescriptioncomputed property debugDescriptionmust use string interpolation and stored properties- Variable viewer and
pshow the summary directly—no expanding every field - If you used
CustomDebugStringConvertiblewithpoand only string interpolation/computed properties, migrate to@DebugDescriptionfor better debugger integration
Core Takeaways
-
What to do: Use breakpoint actions instead of print debugging. Why it’s worth it: No recompile; add and change dynamically; avoids prints shipping to production. How to start: Xcode → right-click breakpoint → Edit Breakpoint → Debugger Command action with
pexpression and auto-continue. -
What to do: Add
@DebugDescriptionto core data types that appear often in collections. Why it’s worth it: See record summaries in the variable viewer instead of expanding each entry. How to start: Annotate the type, implementdebugDescriptionwith string interpolation of key fields. -
What to do: Archive dSYM bundles for every CI build. Why it’s worth it: Offline crashlog analysis needs dSYMs for symbolication; without them you only see addresses, not source lines. How to start: Ensure dSYM generation on Archive; App Store Connect handles uploads; manage archives for internal distribution.
-
What to do: Use conditional breakpoints and ignore counts for high-frequency hits—not give up on breakpoints. Why it’s worth it: Loop breakpoints can fire thousands of times; conditions pause only when needed; ignore count skips known-irrelevant iterations. How to start: Edit Breakpoint → Condition or Ignore Count; CLI:
break modify --conditionor--ignore-count.
Related Sessions
- Symbolication: Beyond the basics — Deep dive into dSYM symbolication for correct crashlog source lines
- Debug with structured logging — How
pworks under the hood and structured logging best practices - What’s new in Swift — Swift 6 overview including @DebugDescription and other macros
- Analyze heap memory — Instruments heap analysis for leaks and performance bottlenecks
Comments
GitHub Issues · utterances