
Highlight
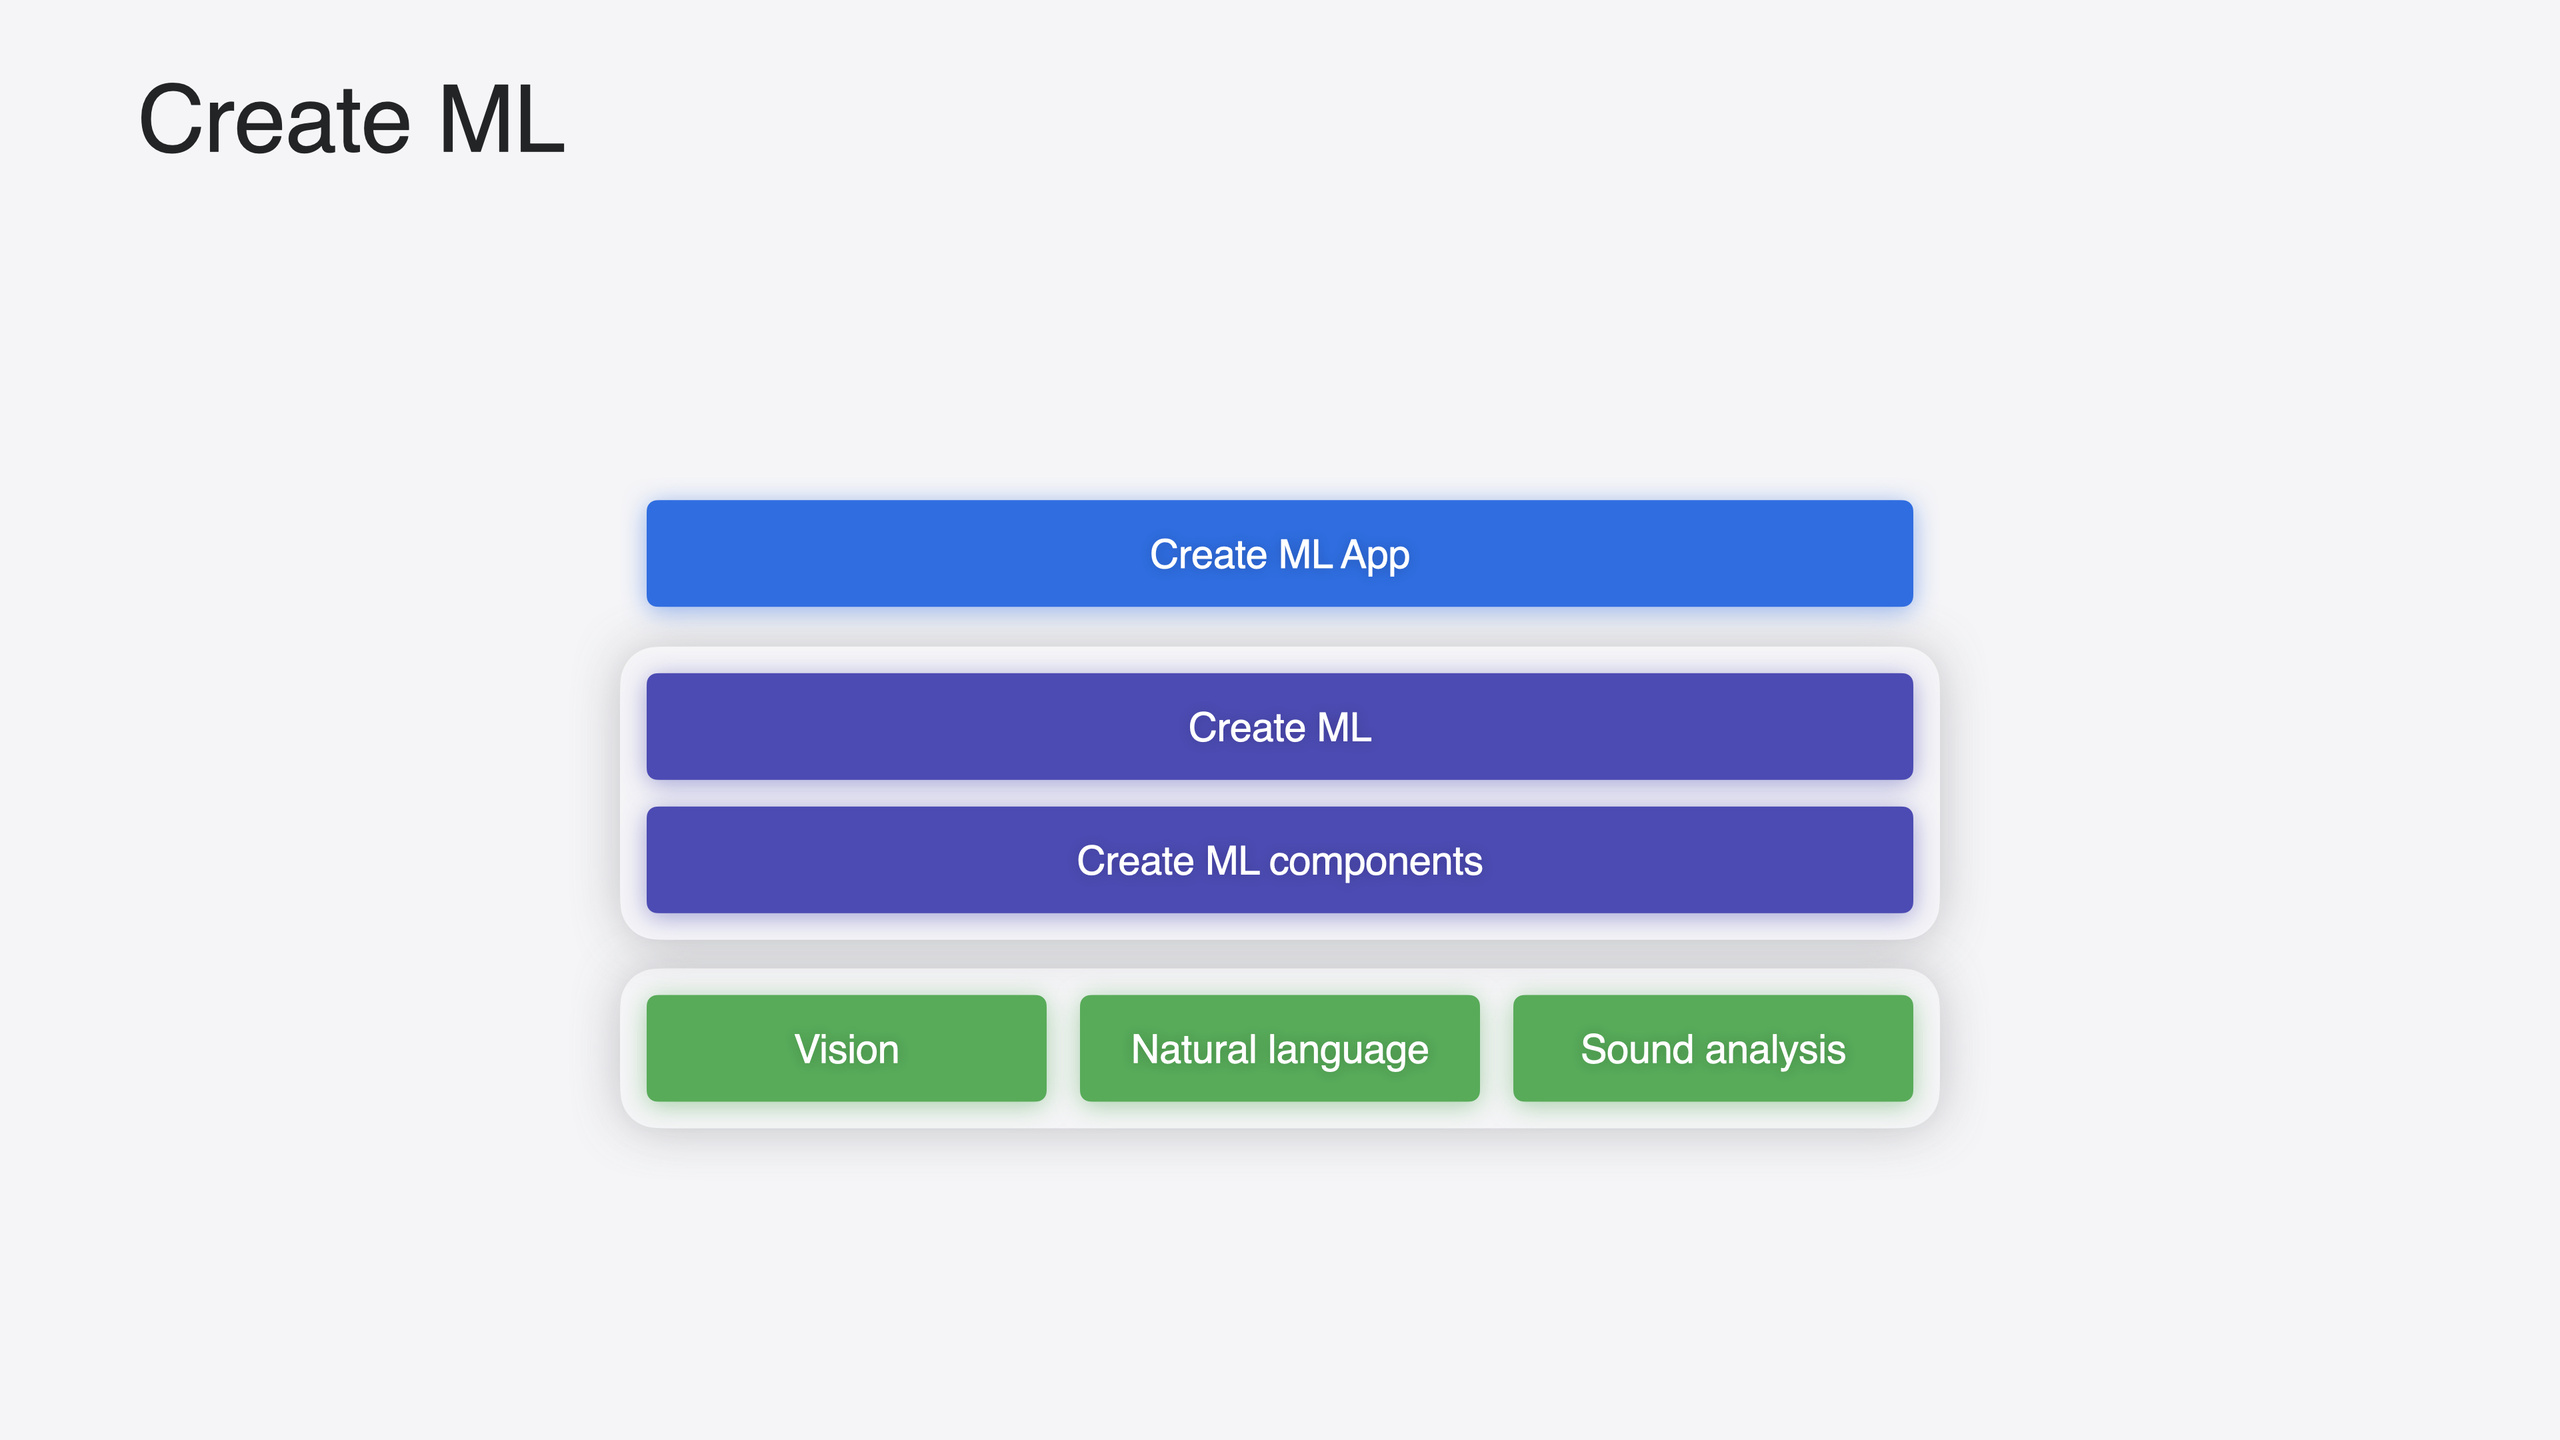
Create ML is Apple’s on-device machine learning training tool, spanning three layers: the App (click-to-train), the Framework (code-based training), and underlying Components (composable model building blocks). This year’s updates cover all three.
Core Content
You train an image detection model, deploy it, and find the same coffee cup detected twice—once labeled on the coffee surface, once on the cup body. This “duplicate detection” problem isn’t in the model—it’s in the annotation data itself. But in the past, Create ML App gave you no way to inspect annotations one by one. This year’s new Explore feature fixes that: click a data source, select a class label, and see each image’s bounding box position and size (03:12). Check before training to avoid “garbage in, garbage out.”
Another major update is Object Tracking—a new template designed for visionOS to train models that track real objects’ spatial position and orientation. Training data needs only one 3D asset; Create ML automatically generates all training samples. In the demo, a real globe was tracked and the app overlaid lunar orbit and core visualizations around it (04:14).
At the Components level, two new general-purpose components were added: time series classification and time series forecasting. Classification answers “what does this data represent?” (e.g., recognizing gestures from watch accelerometer data); forecasting answers “what happens next?” (e.g., predicting sales). Both are general-purpose and handle accelerometer, GPS, sales data, and other time series.
Detailed Content
Data Source Explore Feature
In Create ML App, selecting a data source on the left shows data distribution. The new Explore option lets you drill into a class label and visualize annotation boxes image by image. Works with image classification, object detection, hand pose classification, and other image templates (03:36).
Object Tracking Template
Create ML App adds a Spatial category with an object tracking template for training models that track object spatial position and orientation. Training input needs only one 3D asset—the App auto-generates required training data. See the dedicated video “Explore object tracking for visionOS” for the full workflow (05:01).
Time Series Forecasting: From Data Prep to Training
The session uses a food truck sales forecasting app to demonstrate the full Create ML Components workflow.
Data preprocessing—aggregate per-transaction data into daily sales:
// Create DateFeatureExtractor, extract month and weekday features
let featureExtractor = DateFeatureExtractor(
    featureComponents: [.month, .weekday]
)

// Combine ColumnSelector and featureExtractor into a pipeline
let pipeline = PipelineComposer()
    .compose(ColumnSelector("date"), featureExtractor)
    .append(ColumnConcatenator())

// Fit DataFrame with pipeline to get preprocessor
let preprocessor = pipeline.fit(dataFrame)

// Extract feature and target columns as MLShapedArray
let features = preprocessor.transform(dataFrame)["features"].typedValues()
let targets = dataFrame["quantity"].typedValues()
Key points:
DateFeatureExtractorextracts.month,.weekday, and other feature components from date columns, letting the model learn periodic patterns (09:08)ColumnSelectorpicks specific columns and combines with featureExtractor into a pipelineColumnConcatenatormerges multiple feature columns into oneMLShapedArrayas model input- The preprocessor returned by
pipeline.fit()converts raw DataFrame to the format the model needs
Model training and prediction:
// Split data into training and validation sets
let (training, validation) = data.split(ratio: 0.8)

// Create time series forecaster, configure history and forecast windows
let forecaster = TimeSeriesForecaster(
    inputWindowSize: 15,
    forecastWindowSize: 3
)

// Train
let model = forecaster.fit(training)

// Predict sales for the next 3 days
let predictions = model.applied(input: recentData)
Key points:
inputWindowSizeis the historical data length the model references;forecastWindowSizeis the number of future steps to predict (10:32)- History window should be longer than forecast window—to predict 3 days, provide at least 15 days of history
fit()performs training;applied()performs inference- On-device training benefit: each food truck’s sales pattern differs—on-device training lets the model personalize to specific data (08:26)
Core Takeaways
-
What to do: Use the Explore feature to check annotation quality before training image models. Why it’s worth it: Inconsistent annotations are the top cause of abnormal model behavior, nearly impossible to detect before training. How to start: Open a data source in Create ML App, click Explore, and check bounding box positions are consistent per class label.
-
What to do: Add object tracking to visionOS apps to overlay 3D content. Why it’s worth it: A 3D asset is the only training input—very low barrier, yet delivers spatial computing’s most immersive experiences. How to start: Prepare a 3D asset (USDZ format) of the target object, select the object tracking template under Spatial in Create ML App.
-
What to do: Train time series forecasting models on-device for personalized predictions. Why it’s worth it: Time series data (sales, sensor readings) varies by user/scenario—a unified cloud model can’t capture individual differences. How to start: Use Create ML Components’
TimeSeriesForecaster, setinputWindowSizeandforecastWindowSize, trigger training during user idle time. -
What to do: Use
DateFeatureExtractorto extract periodic features from date columns. Why it’s worth it: Sales and sensor data often have weekly or yearly cycles—extracting.weekdayand.monthlets the model learn these patterns automatically. How to start: AddDateFeatureExtractor(featureComponents: [.month, .weekday])to the data preprocessing pipeline.
Related Sessions
- Explore object tracking for visionOS — Full object tracking workflow from Create ML training to visionOS deployment
- Bring your machine learning and AI models to Apple silicon — How to optimize ML models to fully leverage Apple chip compute
- Deploy machine learning and AI models on-device with Core ML — On-device model conversion and inference performance optimization
- Explore machine learning on Apple platforms — Overview of Apple’s ML framework landscape and where Create ML fits
Comments
GitHub Issues · utterances