
Highlight
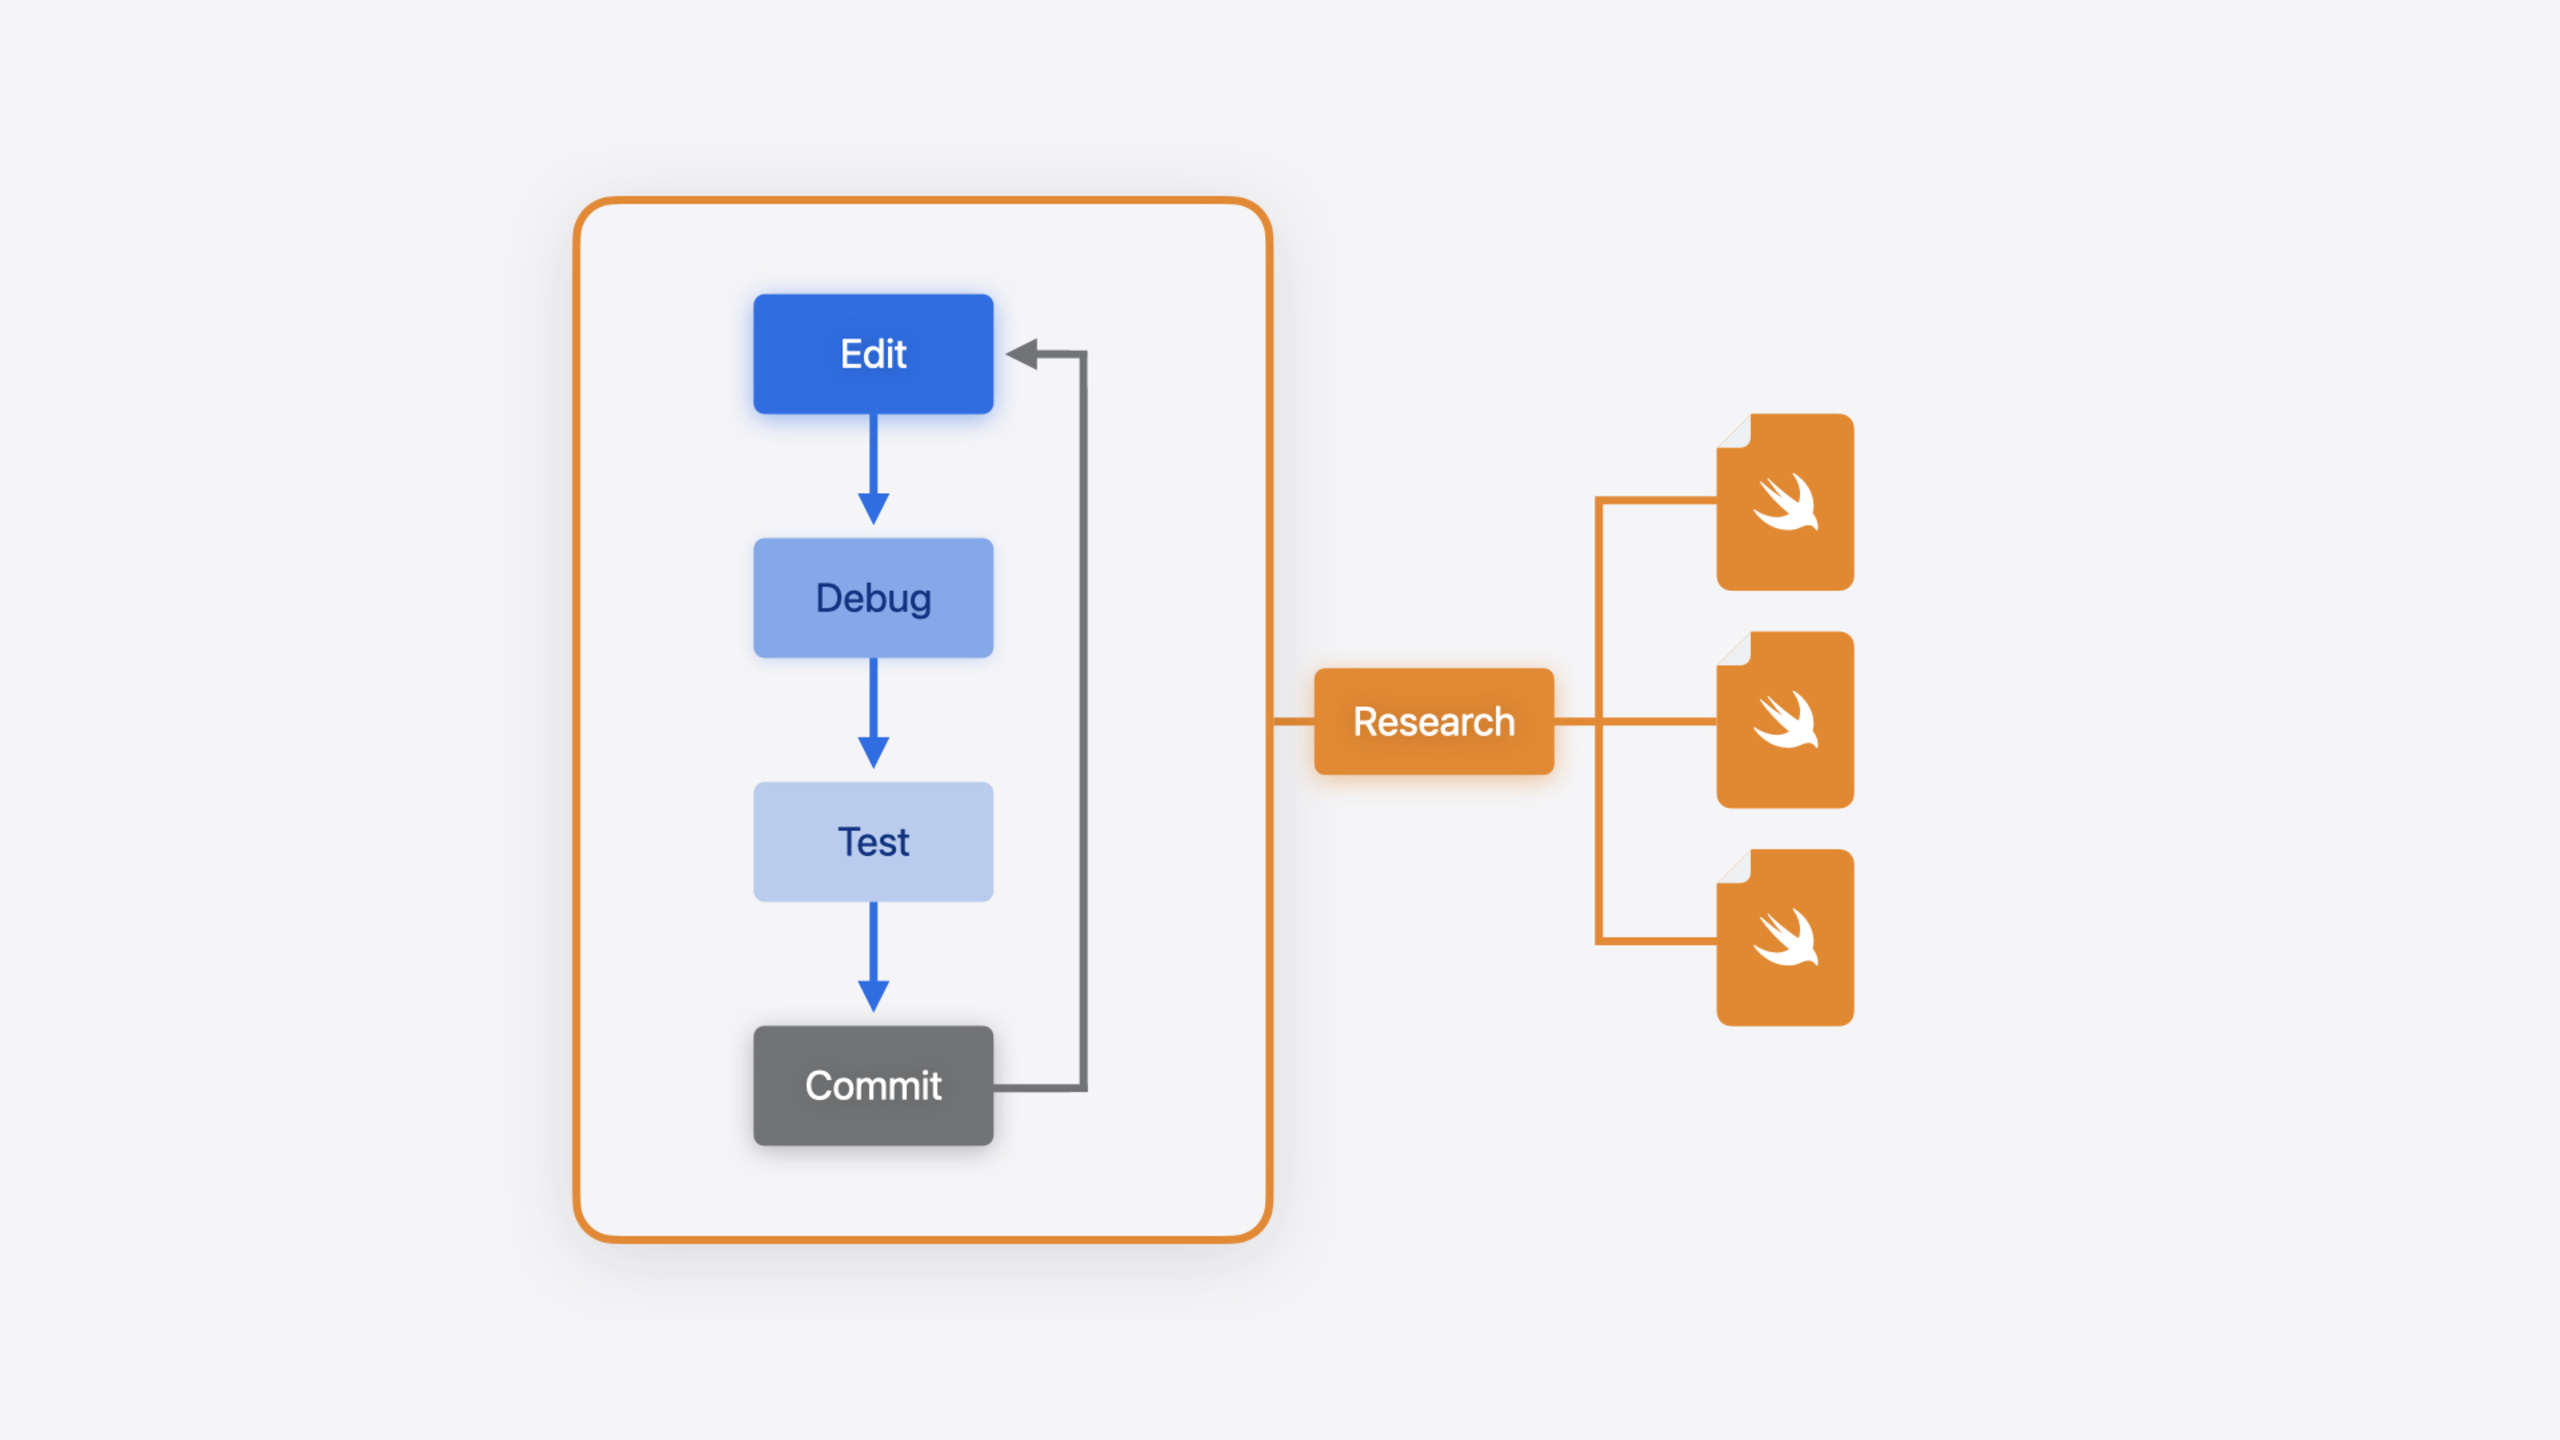
The Xcode team starts from the daily edit-debug-test-commit loop and systematically covers efficiency tips across the full workflow: navigator filtering, Find Navigator advanced search, breakpoint conditions and auto-continue, Swift Testing tag filtering, Code Coverage visualization, and TestFlight distribution.
Core Content
As projects grow and teams expand, “finding the code to change” becomes half the problem. You might search for a symbol across a hundred or two hundred files, manually scroll through piles of search results, or repeatedly restart the app during debugging just to reproduce a crash once. This session’s goal is to help you shorten the time spent on these steps.
The first half, presented by designer Cheech, covers editing and navigation. The core idea: every navigator in Xcode has a filter bar at the bottom; Find Navigator supports saved search scopes and symbol index mode; tabs come in permanent and implicit types; Jump Bar and Open Quickly (Command-Shift-O) are the fastest ways to jump to files. These features are scattered across the UI, but combined they greatly reduce “find the code” time.
The second half, presented by PM Myke, covers debugging, testing, and distribution. The debugging focus is advanced breakpoint usage: conditional breakpoints, auto-continue log breakpoints, Swift Error Breakpoint, and dragging the green program counter to rewind execution. The testing section introduces Swift Testing tag filtering, Test Plans reused across schemes, and line-level Code Coverage visualization. Distribution covers the Archive flow, TestFlight internal/external testing, and feedback and crash data in Xcode Organizer.
Detailed Content
Navigation and Search
The Project Navigator filter bar at the bottom supports searching by filename, filtering by target name, and filtering by git status (show only modified files).
Find Navigator (Command-Shift-F) advanced usage:
- The bottom filter bar performs secondary filtering on search results—filter by filename or additional keywords in matching lines
- Command-click the disclosure arrow next to a filename in search results to collapse all sibling files (works in all outline views)
- Select unwanted results and press Delete to hide them from the current query (doesn’t delete code)
- Search scope can be limited to specific directories; frequently used scopes can be saved
- Click “Text” above the search box to switch to symbol index mode; “Descendant Types” shows class hierarchy (05:10)
After selecting text, press Command-E—the text enters the search box without overwriting the clipboard. This works globally on macOS (05:27).
Moving Between Files and Editing
Xcode tabs come in two types: permanent tabs (files you actively edit) and implicit tabs (files you only browsed—italic title, disappears when you leave). Double-click an implicit tab or right-click and choose “Keep Open” to make it permanent. Option-click the close button to close all tabs except the current one (06:32).
Open Quickly (Command-Shift-O) is Xcode’s fastest navigation: type partial filename or symbol keywords to jump; add a slash in the query to match paths, colon and line number to jump to a specific line. Hold Option while pressing Return to open in a new split (11:22).
Quick Actions (Command-Shift-A) searches Xcode commands in natural language—useful when you can’t remember shortcuts.
Xcode 16’s Predictive Code Completion predicts entire lines based on context. Tab accepts the visible portion; Option-Tab accepts the full prediction. More descriptive comments and variable names improve prediction accuracy (14:24).
Advanced Breakpoint Usage
For frequently hit code, use paired breakpoints: set one on the button handler, manually enable the breakpoint in the busy function after it hits, then continue—so you only stop in the specific scenario (17:39).
Swift Error Breakpoint, added in Breakpoint Navigator, stops the app at any Swift error throw site—not just at catch (18:16):
let url = try! getVideoResourceFilePath()Key points:
try!force-unwraps; failure triggers a runtime error- Swift Error Breakpoint pauses immediately at
throw, not when the app crashes
Conditional breakpoints: double-click a breakpoint to edit, add a condition expression—it only pauses when the condition is true. You can also add print expressions and set “Automatically continue” to get temporary logs without recompiling (18:59):
cloudURL.scheme == "https"Key points:
- This is a boolean expression—the breakpoint only pauses when the URL scheme is “https”
- Useful in high-traffic code when you only care about specific conditions
Add a log expression to a breakpoint and set auto-continue:
p "Username is \(cloudURL.user())"Key points:
pis LLDB’s print command, outputting expression values to the console- With “Automatically continue” enabled, you log info without pausing the program
Debugger Backtrace and Rewind
In the debugger, use the p command to backtrack and analyze why a guard statement returned early (19:44):
guard cloudURLs.allSatisfy({ $0. scheme == "https" }),
    session.configuration.networkServiceType == .video else {
    return
}
Use p cloudURLs.allSatisfy({ $0.scheme == "https" }) and p session.configuration.networkServiceType == .video separately to check each condition’s value and find which is false.
The green program counter can be dragged backward to re-execute previous expressions. Side effects don’t rewind, but it’s faster than fully restarting the debug session (20:11).
Command-Control-R “Run Without Building” skips compilation and runs the last build—ideal when you need repeated debugging but code hasn’t changed (21:02).
Xcode 16 supports viewing full backtraces in the editor—activate from the Debug Bar to consolidate call stacks from different files in one editor view (21:20).
Migrating from print to os_log
The session compares print and os_log debugging approaches. print output is hard to filter and locate:
var releaseDate: Date {
    print("🎬 Entering func \(#function) in \(#fileID)...")
    let currentDate = Date()
    let gregorianCal = Calendar(identifier: .gregorian)
    var components = DateComponents()
    components.year = releaseYear
    print("\(#fileID)@\(#line) \(#function): 📅 releaseYear is \(releaseYear)")
    if releaseYear == gregorianCal.component(.year, from: currentDate) {
        components.month = Int(releaseMonth)
        isNewRelease = true
        print("\(#fileID)@\(#line) \(#function): 🆕 this is a new release!")
    }
    if releaseYear < 2000 {
        isClassicMovie = true
        print("\(#fileID)@\(#line) \(#function): 🎻 this one is a classic!")
    }
    let calendar = Calendar(identifier: .gregorian)
    return calendar.date(from: components)!
}
After switching to os_log, each log has a level (debug/info/error), can be filtered by text, level, and source library, and clicking the arrow jumps directly to the source line (22:09):
var releaseDate: Date {
    os_log(.debug, "🎬 Entering func \(#function) in \(#file)...")
    let currentDate = Date()
    let gregorianCal = Calendar(identifier: .gregorian)
    var components = DateComponents()
    components.year = releaseYear
    os_log(.info, "📅 releaseYear is \(releaseYear)")
    if releaseYear == gregorianCal.component(.year, from: currentDate) {
        components.month = Int(releaseMonth)
        isNewRelease = true
        os_log(.info, "🆕 this is a new release!")
    }
    if releaseYear < 2000 {
        isClassicMovie = true
        os_log(.info, "🎻 this one is a classic!")
    }
    let calendar = Calendar(identifier: .gregorian)
    return calendar.date(from: components)!
}
Key points:
os_log(.debug, ...)andos_log(.info, ...)set a level for each log entry- Console can filter by level, text, and source library—no need to manually add
#fileIDmacros - Log entries have jump arrows—click to navigate to the source line
Swift Testing and Tag Filtering
Swift Testing marks test functions with @Test and replaces XCTAssert with #expect. Tags group and filter tests (24:19):
@Test(.tags(.stars)) func testStarRating() async throws {
    for video in library.videos {
        #expect(video.info.starRating > 0)
        #expect(video.info.starRating <= 5)
    }
}

@Test(.tags(.library)) func testLibraryLoaded() async throws {
  #expect(library.videos.count > 1)
}

extension Tag {
  @Tag static var stars: Tag
  @Tag static var library: Tag
}
Key points:
.tags(.stars)tags a test; filter by tag in Test Navigator#expectis Swift Testing’s assertion macro—more concise syntax than XCTAssert- Tag definitions go in
extension Tagas static properties
Run tests from the command line specifying scheme, test plan, or even a single test (26:35):
xcodebuild test -scheme DestinationVideo
xcodebuild test -scheme DestinationVideo -testPlan TestAllTheThings
xcodebuild test -scheme DestinationVideo -testPlan TestAllTheThings -only-testing "Destination VideoUITests/testABeach"
Key points:
- First command runs all tests under the scheme
-testPlanspecifies a test plan-only-testingruns only a specific test case—useful withgit bisectto locate regressions
Code Coverage
After enabling Code Coverage from the Editor menu and running tests, the editor shows execution counts per line on the right. 0 means uncovered—possibly a test gap or dead code (29:03).
Report Navigator (Command-9) provides file-level and function-level coverage overview to help identify improvement targets.
In Test Report, clicking a failed test shows execution events alongside screen recordings, with the timeline marking when the failure occurred (29:57).
Distribution and Organizer
An Archive is a snapshot of the compiled app, including the release build and debug symbols. Distribution options include: App Store Connect (upload to TestFlight or App Store Connect), TestFlight Internal Only (skip App Review, organization-internal testers only), Release Testing / Enterprise / Debugging (builds for registered devices) (31:54).
Xcode Organizer (Command-Option-Shift-O) aggregates TestFlight feedback, launch time, termination rate, and more—data from users who consent to share, privacy-safe. The Feedback tab shows tester written feedback; Launch and Termination tabs help locate performance issues and crashes (33:36).
Core Takeaways
-
What to do: Save frequently used search scopes in Find Navigator. Why it’s worth it: In large projects, repeatedly searching the same directories is common—saved scopes switch with one click. How to start: When searching, click the scope menu below the search box, choose “Custom Scopes…”, select directories, and save.
-
What to do: Use conditional breakpoints + auto-continue instead of temporary print statements. Why it’s worth it: No code changes, no recompilation—breakpoint logs go straight to the console; delete the breakpoint when done. How to start: Double-click a breakpoint, add a
pexpression, check “Automatically continue after evaluating actions”. -
What to do: Migrate print debug logs to os_log. Why it’s worth it: os_log supports filtering by level and source library, click-to-source navigation—more controlled console output for team collaboration. How to start: Replace
print("...")withos_log(.debug, "..."), remove manual#fileIDand#functionmacros. -
What to do: Add Tag labels to Swift Testing tests. Why it’s worth it: As test count grows, filtering by tag is more efficient than searching by name—one-click filter for a module’s tests in Test Navigator. How to start: Add
.tags(.yourTag)to the@Testattribute, define static tags inextension Tag. -
What to do: Use Command-Control-R (Run Without Building) to speed up repeated debugging. Why it’s worth it: When debugging crashes you often restart the app—if code hasn’t changed, skip recompilation and save build wait time. How to start: Next debug cycle, press Command-Control-R instead of Command-R.
Related Sessions
- Run, Break, Inspect: Explore effective debugging in Xcode — Advanced debugging techniques including breakpoints, LLDB, and view debugging
- Meet Swift Testing — Introduction to the Swift Testing framework, a new testing paradigm replacing XCTest
- Debug with structured logging — Structured logging with os_log and console filtering
- What’s new in Xcode 16 — Overview of all new Xcode 16 features
Comments
GitHub Issues · utterances