
Highlight
This session covers Xcode 16 updates across the full development workflow. For editing, code completion uses a device-trained Swift/Apple SDK model that gives more relevant suggestions based on function names and comment context, powered entirely by local Apple Silicon compute.
Core Content
Xcode 16 updates span coding, building, debugging, testing, and profiling. Consider a common pain point: using @State in Previews required a wrapper view containing only @State properties, then referencing it in the Preview. Every view needing a Binding doubled code and maintenance cost. The @Previewable macro solves this directly—declare @Previewable @State var currentFace = ... in the Preview block, and the preview system generates the wrapper behind the scenes. Two lines of code is all you need.
Another pain point: multiple Previews sharing environment data (such as a SwiftData ModelContainer), each initializing its own copy—redundant and slow. The PreviewModifier protocol initializes shared data once, cached by the preview system.
For builds, module dependency scanning and compilation were implicitly nested inside source file compilation. Build logs only showed “Compile xxx.swift,” making it hard to tell module issues from source issues. Explicit Modules splits compilation into three explicit phases: scan dependencies, build modules, compile source. Each phase is independently visible in build logs and Timeline, with better parallelism and clearer module-related errors. C/Objective-C enables it by default; Swift requires opt-in in Build Settings.
Detailed Content
The Previewable macro (03:37) lets property wrappers like @State be used directly in Preview blocks:
#Preview {
    @Previewable @State var currentFace = RobotFace.heart

    RobotFaceSelectorView(currentFace: $currentFace)
}
Key points:
@Previewablemodifies@State; the preview system creates a wrapper view behind the scenes—no manual wrapper neededcurrentFacecan pass$currentFaceas a Binding, behaving like normal@State- Preview a view needing a Binding in just two lines of code
The PreviewModifier protocol (04:40) solves shared data across previews:
struct SampleRobotNamer: PreviewModifier {
    typealias Context = RobotNamer

    static func makeSharedContext() async throws -> Context {
        let url = URL(fileURLWithPath: "/tmp/local_names.txt")
        return try await RobotNamer(url: url)
    }

    func body(content: Content, context: Context) -> some View {
        content.environment(context)
    }
}
Key points:
makeSharedContext()isasync throws, can load data asynchronously, and is called only once per Modifier type—the preview system caches automaticallybody(content:context:)injects shared data into the view hierarchy, here via.environment()- With a
PreviewTraitextension, call sites compress to a single.sampleNamertrait
The Swift Testing framework (13:42) replaces some XCTest usage:
import Testing
@testable import BOTanist

@Test
func plantingRoses() {
    let plant = Plant(type: .rose)
    let expected = Plant(type: .rose, style: .graft)

    #expect(plant == expected)
}
Key points:
- The
@Testmacro marks test functions; names are free—notestprefix required #expectaccepts any boolean expression; failures automatically show value differences- Test functions can attach custom Tags via
.tags()for grouped runs or Test Plan exclusion
Explicit Modules builds (06:26) split compilation into scan dependencies, build modules, and compile source. Build logs show independent entries like “Scan dependencies” and “Compile Swift module”; Timeline shows time per phase. C/ObjC enables by default; Swift enables via “Enable Explicitly Built Modules” in Build Settings. Xcode 16 also supports starting builds before Swift Package resolution completes (07:15).
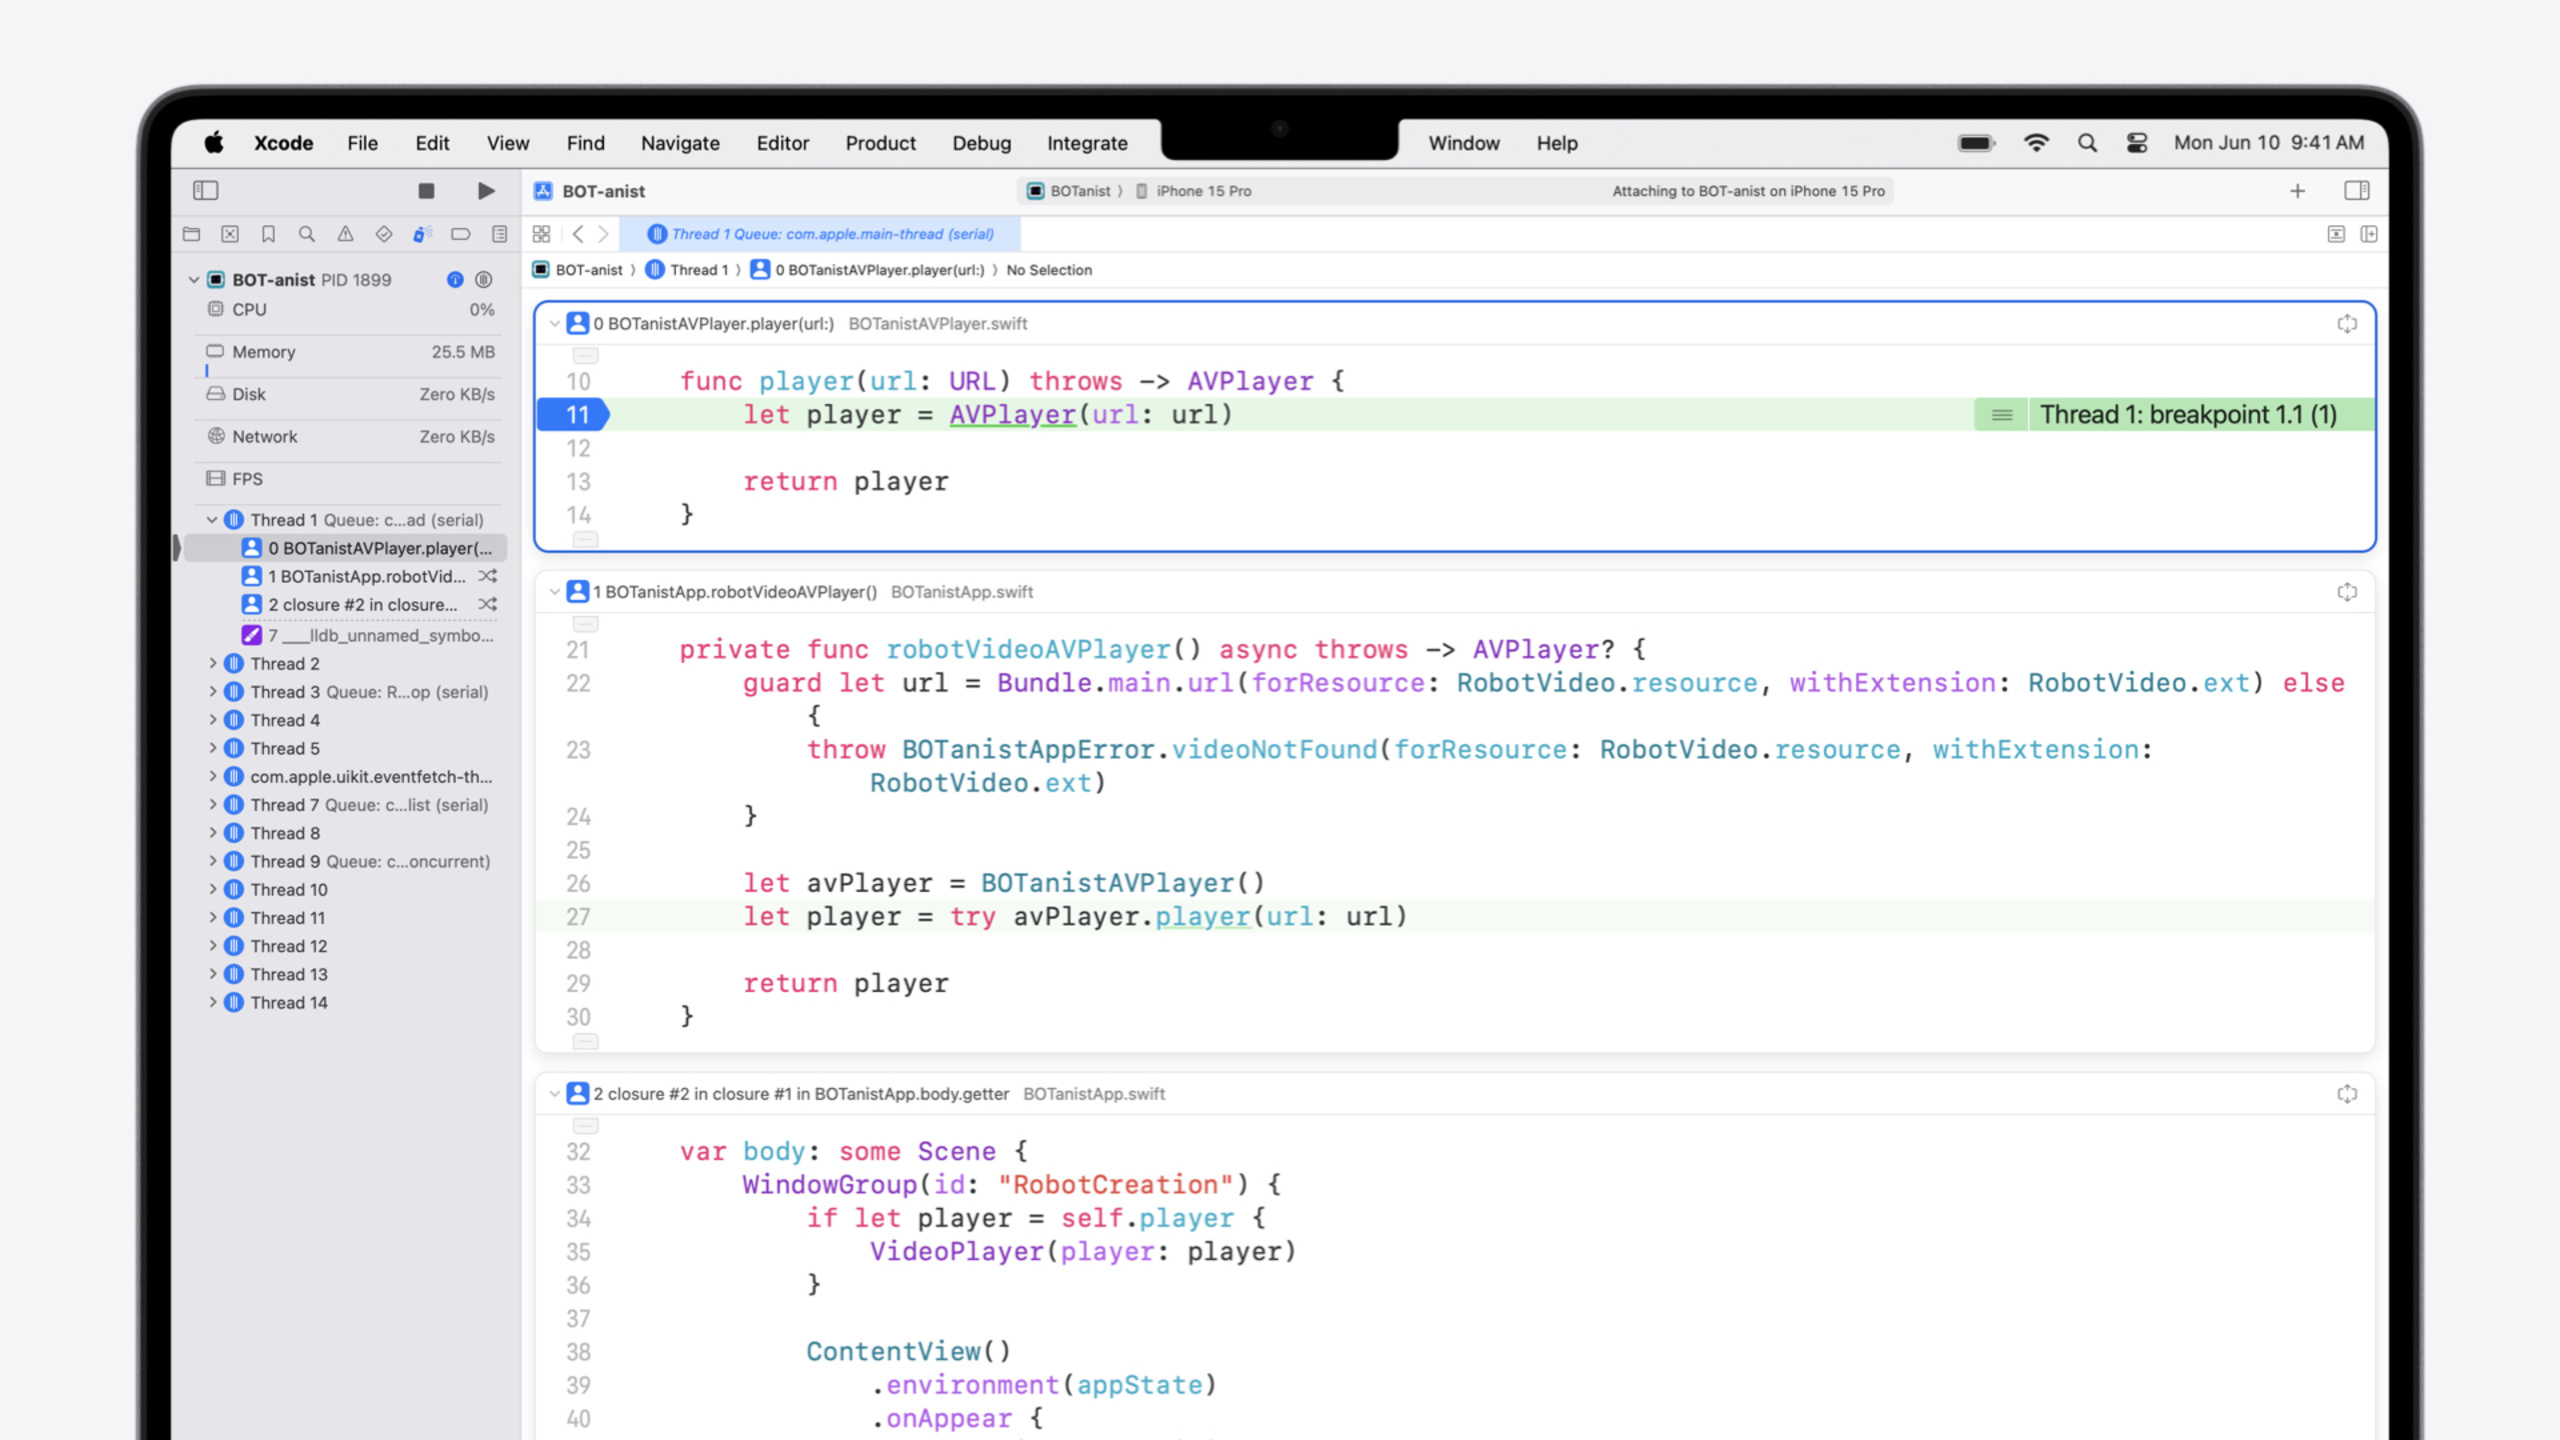
Debugging improvements: DWARF5 is the default debug symbol format for macOS Sequoia / iOS 18 deployment targets—smaller dSYMs, faster symbol lookup. Thread Performance Checker adds slow launch and excessive disk write diagnostics. Unified Backtrace View (10:56), enabled from the Debug Bar, lets you scroll continuously through each stack frame’s code and variable values without clicking frame by frame. The RealityKit debugger (12:16) captures spatial app Entity hierarchy snapshots in one click, browsable in 3D inside Xcode.
Instruments Flame Graph (19:42) provides area visualization of call stacks—the left side shows the most expensive paths. The session demo used Flame Graph to find a serial asset.load() loop, switching to a parallel Task Group to significantly reduce launch time:
await withDiscardingTaskGroup { group in
    for asset in allAssets {
        group.addTask {
            asset.load()
        }
    }
}
Core Takeaways
-
What to do: Gradually enable Swift 6 Upcoming Features in your project. Why it’s worth doing: Data races go from occasional runtime issues to compile-time certainties—the earlier you fix, the lower the cost. How to start: In Build Settings under “Swift Compiler - Upcoming Features,” enable one at a time (Isolated Global Variables, Strict Concurrency, etc.), fix warnings for each category before enabling the next.
-
What to do: Wrap shared preview environments with PreviewModifier. Why it’s worth doing: SwiftData ModelContainer, mock network layers, etc. get re-initialized across Previews—redundant and slows preview refresh. How to start: Define a
PreviewModifier, initialize ModelContainer or mock data inmakeSharedContext(), extendPreviewTraitwith.myModifier, and all Previews use the same trait to share cached data. -
What to do: Use Swift Testing instead of XCTest for new test files. Why it’s worth doing:
@Testmacro +#expectis more concise; parameterized tests parallelize naturally; Tag mechanism is more flexible than XCTest filters. How to start: Import Testing in new test files, mark with@Test func xxx(), assert with#expect; existing XCTest is unaffected—both coexist. -
What to do: Enable Explicit Modules for Swift targets. Why it’s worth doing: Explicit compilation phases improve parallelism and clarify module errors; lldb expression evaluation can reuse module build artifacts for faster debugging. How to start: Enable “Enable Explicitly Built Modules” in Build Settings and watch for new “Scan dependencies” / “Compile Swift module” entries in build logs and Timeline.
Related Sessions
- Migrate your app to Swift 6 — How to gradually enable Swift 6 concurrency safety features
- Meet Swift Testing — Swift Testing framework intro covering @Test, #expect, and parameterized tests
- Demystify explicitly built modules — Deep dive into Explicit Modules’ three-phase build model
- Break into the RealityKit debugger — Inspect spatial app Entity hierarchies with the new RealityKit debugger
- Run, break, and inspect: Explore effective debugging in LLDB — Advanced LLDB debugging techniques and Xcode 16 debugging workflows
Comments
GitHub Issues · utterances