
Highlight
CloudKit Console at WWDC 2024 adds four capabilities—developer notifications, Telemetry visualization, structured log queries, and custom alerts—letting developers locate and resolve CloudKit issues without writing code.
Core Content
Your app syncs data to iCloud with CloudKit, and something goes wrong in production—what do you do? Previously you could only dig through Xcode logs and guess at causes. If error rates suddenly spike on one platform, or a user’s quota exceeded triggers a flood of failed requests, local logs rarely reveal it. CloudKit Console at WWDC 2024 fills this gap with four observability capabilities: developer notifications, Telemetry charts, log queries, and custom alerts.
Developer notifications tell you what’s happening in your container first—schema changes, database alerts, promotion operations—all pushed to the Console notification bell and email. Telemetry visualizes your app’s CloudKit requests across five dimensions: requests, errors, error rate, latency, and bandwidth, with grouping by platform and operation, time ranges, and filters. The session demo shows a typical workflow: spot abnormal Apple Watch error rate on the Error Rate chart, use Group By operation to pinpoint the failing operation, then jump to logs for full single-request data and discover one user triggering many Quota Exceeded errors. Custom alerts let you set thresholds on Telemetry metrics so you’re notified automatically when issues recur.
Detailed Content
Developer Notifications (00:35)
The notification bell at the top of Console is the entry point. CloudKit developer notifications cover: database alerts, schema changes, promotions, resets, authorization token status. Tapping a notification jumps to the corresponding Console page—for example, a schema change notification goes to Schema History, which records all historical schema changes your team made to the container (02:38).
Notifications can be configured per container. In Settings > Notifications, choose which notification types to receive and whether via Web or Email. Enabling “Manage Containers” and selecting only relevant containers avoids test container noise (02:57).
Telemetry Visualization (04:06)
Telemetry provides five core metric charts:
- Requests: Total request volume
- Errors: Total error volume
- Error Rate: Error rate (errors / total requests as percentage)
- Latency: Latency
- Bandwidth: Bandwidth
Each chart supports Group By (platform, operation, etc.), time range filtering, and query filters. The session troubleshooting path:
- Receive a database alert notification, click through to alert details (04:34)
- Change Group By to platform; Watch errors are abnormally high (05:13)
- Switch to Error Rate chart; confirm Watch error rate far exceeds other platforms (05:41)
- Filter platform to Watch in query builder, then Group By operation to pinpoint the failing operation (06:03)
Telemetry query URLs can be shared directly with teammates so everyone sees the same analysis view (06:48). The Usage page also provides active user counts, device distribution, and records vs. assets storage breakdown (06:55).
Log Queries (07:15)
The Logs page shows complete request data for every CloudKit operation your app triggers. From Telemetry, click “Query in Logs” and all filters carry over automatically—no reconfiguration needed (07:39).
Logs support Table View mode with customizable columns. The session demo adds a userId column and immediately discovers a single user triggering many Quota Exceeded errors (08:27). Expanding a single log shows complete request data for that event. Results can be exported as CSV or JSON (08:54), or save query conditions or share via “Copy Log Link” with the team.
Custom Alerts (09:26)
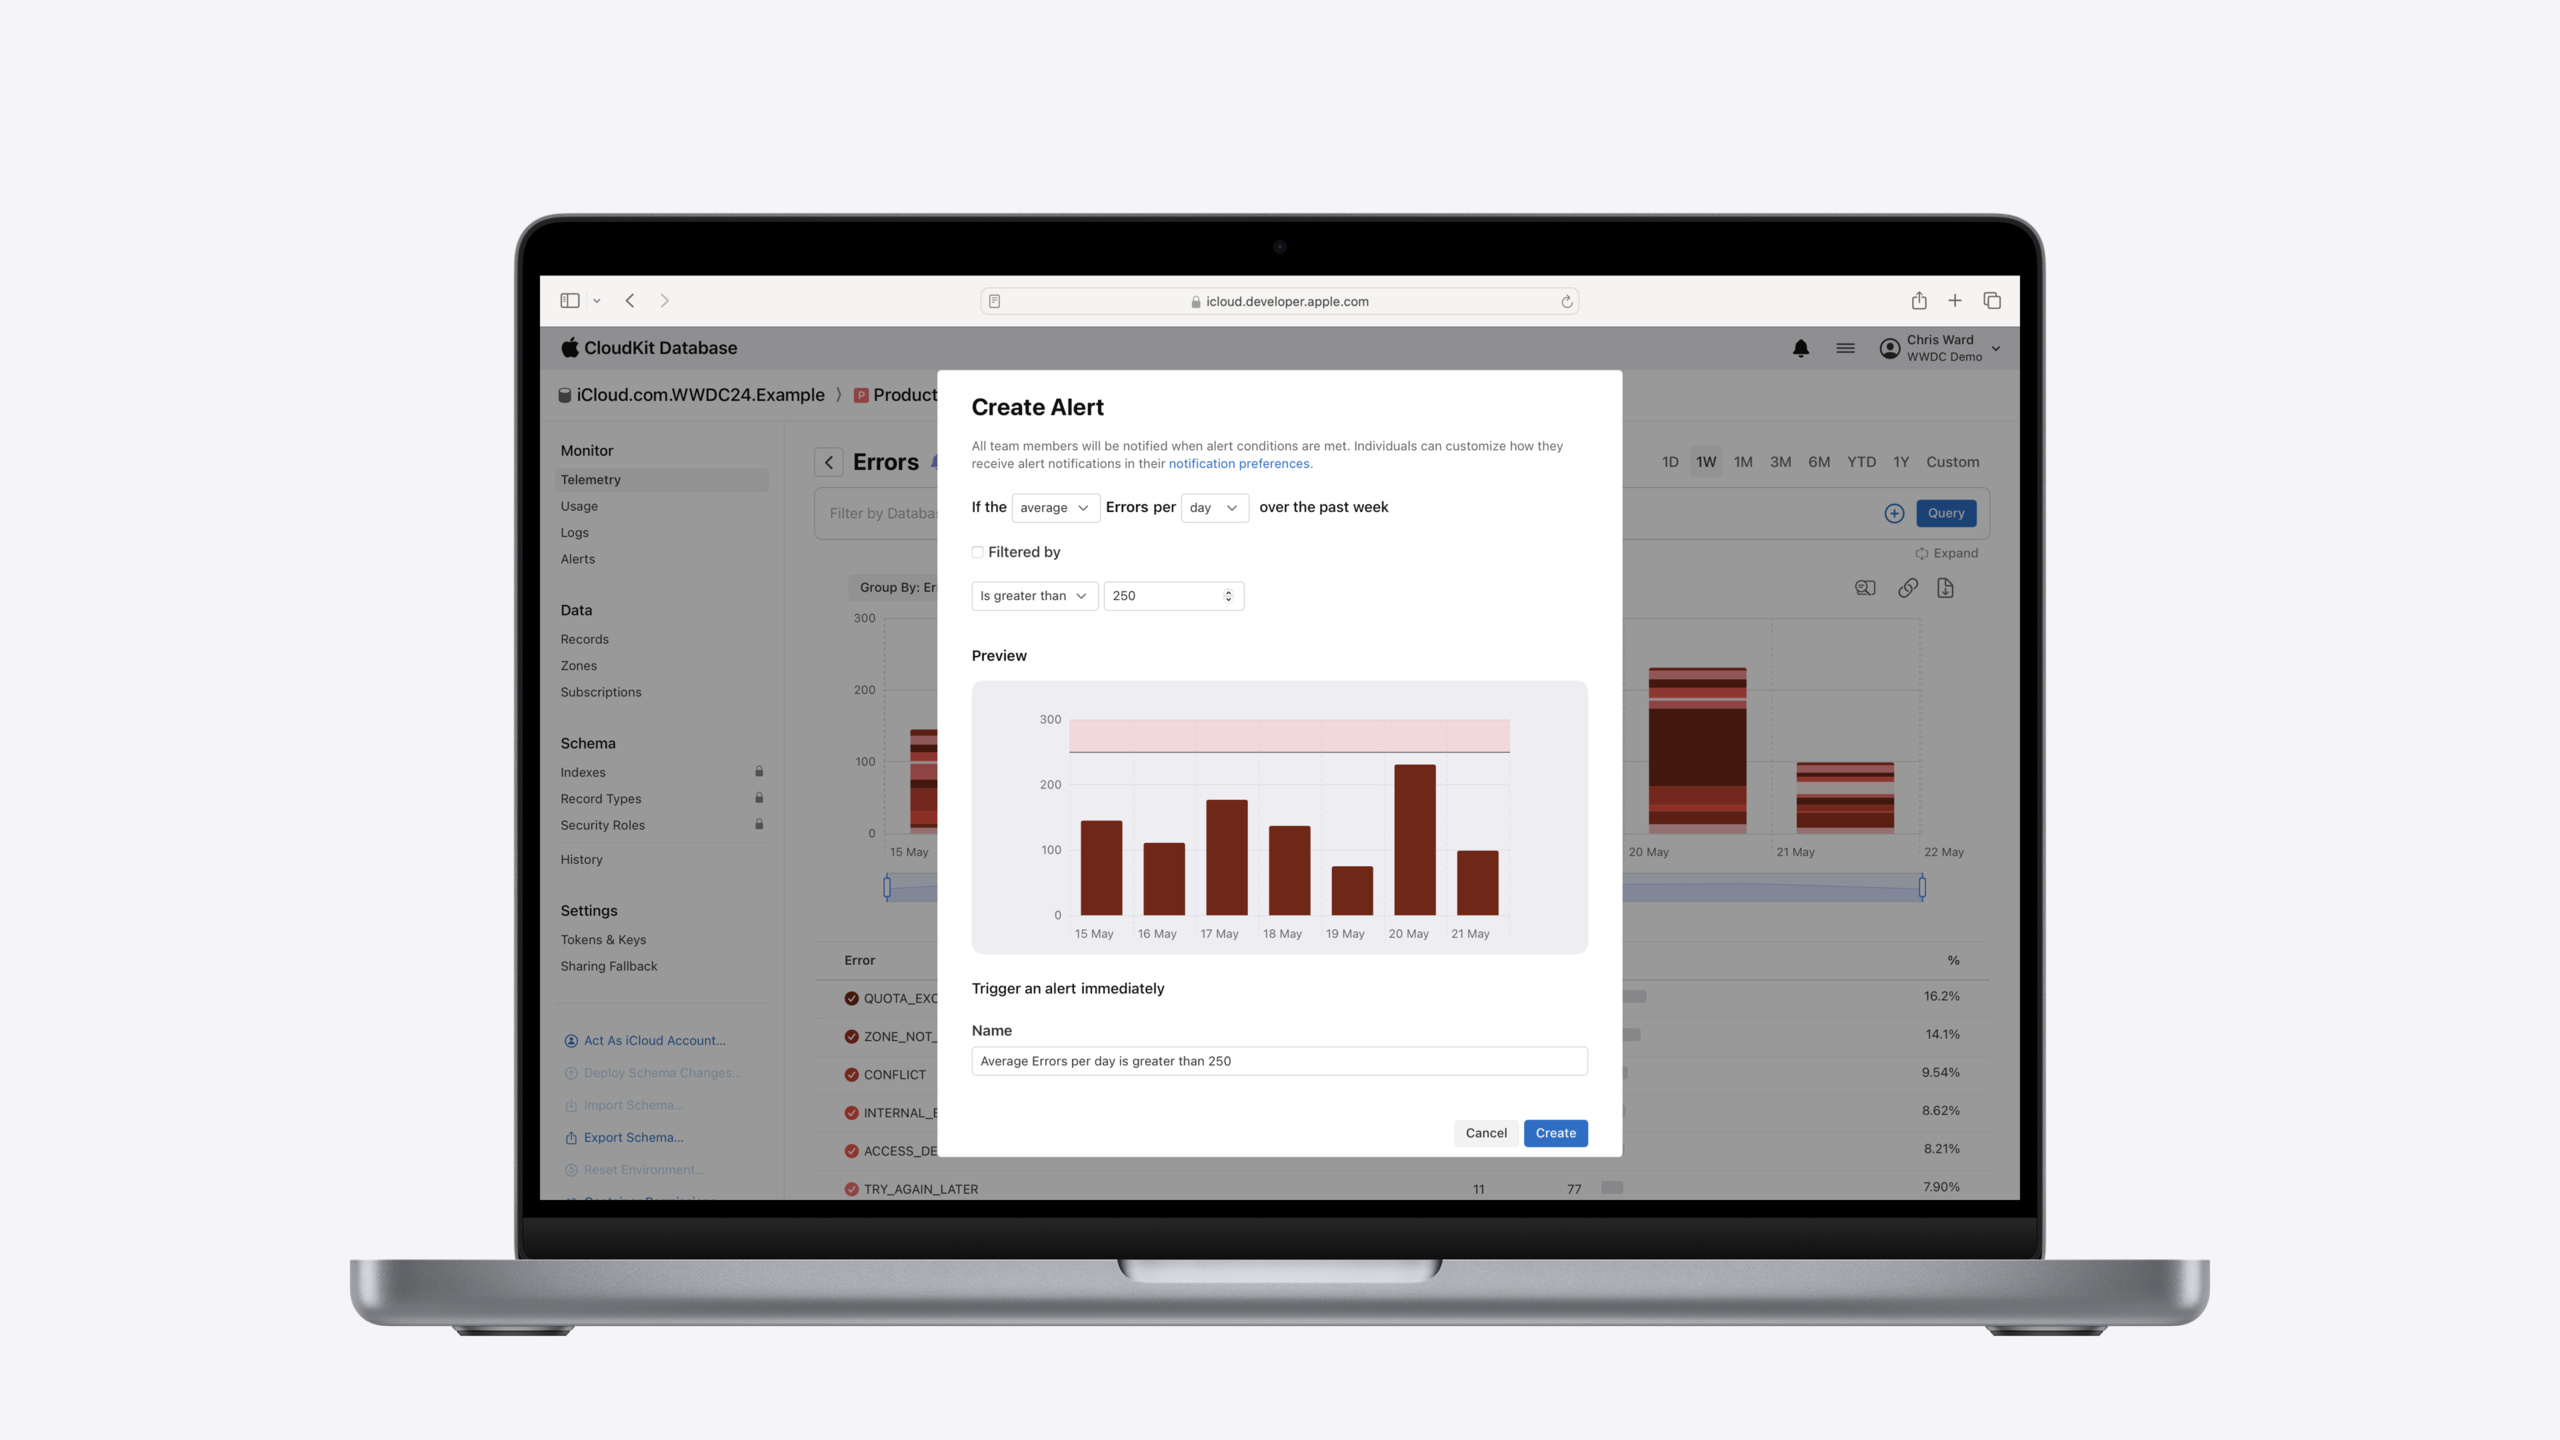
Custom alerts support threshold rules on Requests, Errors, and Error Rate metrics. Creation flow: click “Create Alert” below a Telemetry chart to open the alert dialog. The dialog shows an alert preview chart—highlighted regions represent threshold ranges; moments intersecting highlighted regions trigger alerts (10:15).
Alert filters automatically inherit current Telemetry query filters, ensuring alerts target only the issues you care about. Configure monitoring period (such as hourly); thresholds default to container historical averages but can be adjusted manually (10:42). Created alerts are managed on the Alerts page with enable, disable, and delete support (12:27).
The session gives two alert use cases: when launching on a new platform, configure alerts on error counts to track launch quality; after sync logic optimization, set average-based threshold alerts on sync operation counts to detect regressions (11:49).
Core Takeaways
-
What to build: Configure custom alerts for production CloudKit containers. Why it’s worth doing: Production issues are often discovered by users before developers; alerts shorten response time from “user complaints” to “minute-level automatic notification”. How to start: On CloudKit Console Telemetry, select Error Rate, group by platform, click “Create Alert”, set threshold to 2–3× container historical average.
-
What to build: Replace digging through Xcode logs with Telemetry + Logs combined troubleshooting. Why it’s worth doing: Xcode logs only show local single-device data; Telemetry shows aggregated data across all users; Logs show full context for single requests—together they quickly distinguish global vs. single-user issues. How to start: Next CloudKit sync issue, open Console Error Rate chart, Group By platform to narrow scope, then “Query in Logs” for failed request details.
-
What to build: Save common Telemetry and log queries as shareable links in team documentation. Why it’s worth doing: Different people troubleshooting the same issue often rebuild identical queries; saving and sharing eliminates duplicate work and helps on-call ramp up quickly. How to start: After configuring filters on Telemetry or Logs, copy the browser URL or click “Copy Log Link”, paste into team Slack or Confluence.
Related Sessions
- What’s new in SwiftData — Latest updates to the SwiftData persistence framework
- Create a custom data store with SwiftData — Build custom data store solutions with SwiftData
- Break into the RealityKit debugger — Inspect entity hierarchies in spatial apps with the RealityKit debugger
- Run, Break, Inspect: Explore effective debugging in LLDB — Practical LLDB debugging techniques and efficient breakpoint strategies
- What’s new in Xcode 16 — Overview of new developer tool features in Xcode 16
Comments
GitHub Issues · utterances