
Highlight
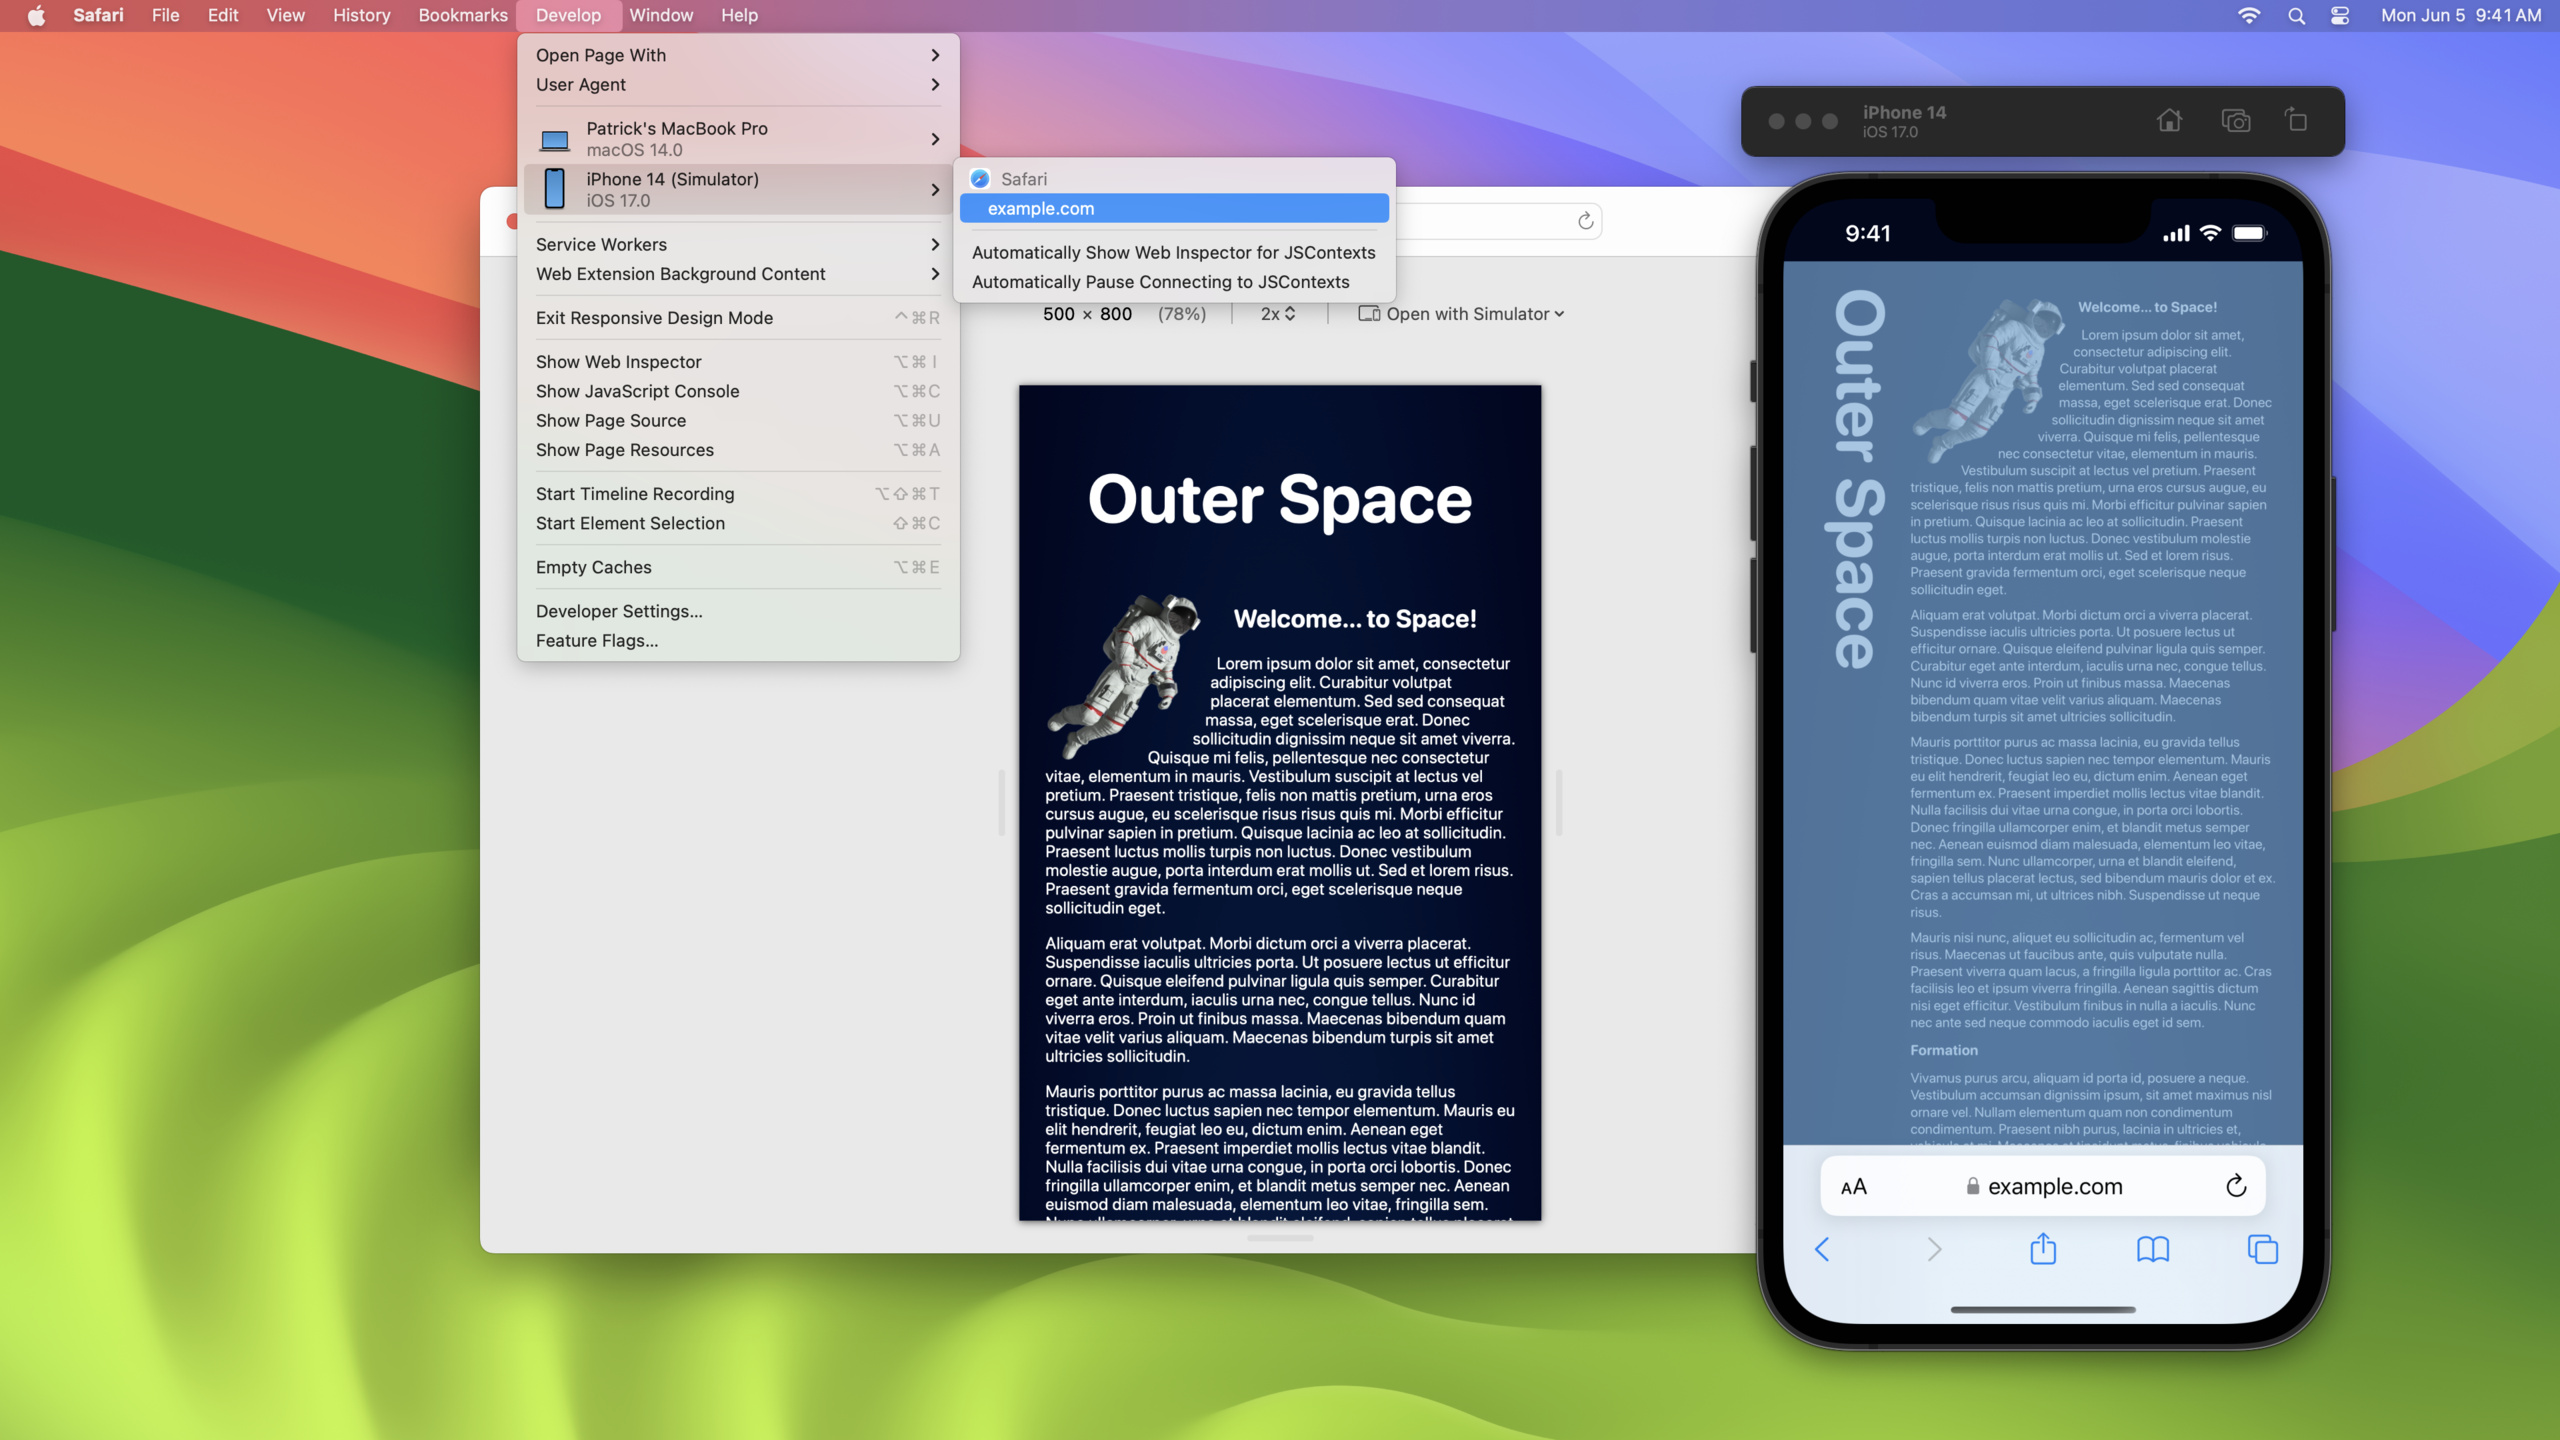
Safari’s suite of developer tools this year adds Simulator integration, Vision Pro wireless debugging, and in-app web content inspection (
isInspectable), and redesigned Feature Flags settings, allowing web developers to complete cross-platform debugging and testing on Mac.
Core Content
Enable developer features
If you are using Safari’s developer features for the first time, you need to enable them in Safari settings (01:39). Open Safari > Settings > Advanced and check “Show features for web developers”.
Quick way to open Web Inspector
Safari redesigns the Develop menu to make key tools easier to find (02:34). There are two ways to open Web Inspector:
- Develop menu: Select “Show Web Inspector”
- Right-click menu: Control-click anywhere on the page and select “Inspect Element”. The element will be directly selected and the Inspector will be opened.
In Element Selection mode, mouseover will display the element’s selector, layout information (margin, shape outlines) and accessibility roles (03:24).
Responsive Design Mode
Responsive Design Mode helps test page performance on different screen sizes (04:56). you can:
- Drag the edge of the viewport to adjust the size, and the page content will automatically rearrange
- Enter exact width and height values
- Modify the pixel ratio to test high-resolution screens
When the viewport height exceeds the window, Safari automatically scales the display (for example, to 78% of the actual size).
Open Simulator directly from Safari
New this year: The ability to open iOS, iPadOS, and xrOS simulators directly from Safari to test web pages (06:52).
Operation path: Develop > Open with Simulator. Running emulators will be at the top of the list. If the emulator is not running, the system automatically starts it.
Safari in the simulator exhibits different layout behavior than the macOS version. For example, under the same width, the viewport performance of iOS Safari will be larger. You can also test iOS-specific interactions like smooth scrolling and double-tap to zoom.
Pages in the simulator can also be inspected with Web Inspector: Find the corresponding simulator in the Develop menu and select the page you want to inspect (08:27).
Real machine debugging
iOS and iPadOS devices can be debugged over a cable or wireless network (09:33).
Wired connection:
- Open Settings > Safari > Advanced on the device and enable Web Inspector
- Connect to Mac with data cable
- Find the device in the Develop menu of Mac Safari and select the page you want to check
Wireless Connection:
- Select “Connect via Network” in the Develop menu
- Make sure the device and Mac are on the same network
- Unplug the data cable and continue wireless debugging
Vision Pro Debugging
xrOS devices also support debugging from Mac Safari (11:24). Pairing process:
- Open Settings > Apps > Safari > Advanced on Vision Pro and enable Web Inspector
- Leave the screen open in Settings > General > Remote Devices
- In Mac Safari’s Develop menu, select “Use for Development” from the device’s submenu.
- Vision Pro will display the 6-digit pairing code, enter it on your Mac
- After pairing is completed, you can debug wirelessly.
Once paired, Element Selection mode also supports Vision Pro: look at the target element on the device and pinch to select (12:56).
Make web content within the app inspectable
Starting from iOS 16.4 / macOS 13.3 / xrOS, App can actively make WKWebView and JSContext checkable (13:41).
import WebKit
import JavaScriptCore

let webConfiguration = WKWebViewConfiguration()
let webView = WKWebView(frame: .zero, configuration: webConfiguration)

if #available(macOS 13.3, iOS 16.4, *) {
    webView.isInspectable = true
}

let jsContext = JSContext()
jsContext?.name = "Context name"

if #available(macOS 13.3, iOS 16.4, tvOS 16.4, *) {
    jsContext?.isInspectable = true
}
Key points:
isInspectable = trueMake WKWebView visible in Safari’s Develop menu- JSContext recommended settings
name, to facilitate distinguishing multiple contexts in the Develop menu - This API is also available in the release version of the App to facilitate production environment debugging.
WebDriver automated testing
Safari supports WebDriver for cross-browser automated testing (14:34). WebDriver is a local HTTP server that accepts automated commands and supports operations such as finding elements, obtaining accessibility roles, executing JavaScript, and taking screenshots.
Python example with Selenium:
from selenium import webdriver
from selenium.webdriver.common.by import By
from selenium.webdriver.safari.options import Options as SafariOptions

options = SafariOptions()
driver = webdriver.Safari(options=options)

driver.get("https://webkit.org/web-inspector/")

search_element = driver.find_element(by=By.ID, value="search")
search_element.send_keys("device")

assert(driver.find_element(by=By.LINK_TEXT, value="Device Settings"))

driver.quit()
Key points:
- The title bar of the automation window will display orange, indicating that it is being controlled by automation
- Tests can be run on iOS/iPadOS simulators and real devices
- Safari’s WebDriver implementation requires no browser-specific code
Feature Flags
Safari has redesigned the Feature Flags setting (formerly Experimental Features) to preview future web platform features (17:01).
Feature Flags are organized by topic (Animation, CSS, JavaScript, Media, etc.) and are searchable. Each feature has four states:
| Status | Description | Default Switch |
|---|---|---|
| Stable | Enabled by default in Safari, can be manually turned off to test compatibility | On |
| Testable | Early implementation for feedback on standard specifications | Close |
| Preview | The function is more complete and is turned on by default in Safari Technology Preview | Off |
| Developer | Adjust WebKit behavior or re-enable deprecated APIs | As appropriate |
Key points:
- Safari Technology Preview is released approximately every two weeks to experience the latest features in advance
- Feature Flags will be automatically reset to default values after updating Safari
- Search function can quickly find related features (for example, search for “color” to find all color-related features)
Detailed Content
Processing of high-resolution images
Responsive Design Mode supports modifying the pixel ratio and testing screens with different resolutions. Web developers have three ways to respond to high-resolution screens (06:20):
HTML srcset:
<img
  src="astronaut_1x.jpg"
  srcset="astronaut_2x.jpg 2x, astronaut_3x.jpg 3x"
/>
Key points:
srcis the default picture -srcsetLists versions with different resolutions, and the browser automatically selects them based on the device pixel ratio
CSS image-set:
.starfield {
  background-image: image-set("stars_1x.jpg" 1x, "stars_2x.jpg" 2x);
}
Key points:
image-setCan be used anywhere a picture is needed- The browser automatically selects the appropriate resolution version
CSS resolution media query:
@media (min-resolution: 2dppx) {
  .divider-line {
    border: 0.5px solid grey;
  }
}
Key points:
dppxRepresents the number of device pixels per CSS pixel- Any style, such as border thickness, can be adjusted for high-resolution screens
Practical Tips for Web Inspector
- Color Picker: Click the gradient preview in the Styles sidebar and use the color picker to pick a color from anywhere on the screen (03:54)
- Undo modifications: Command-Z can undo style modifications in Web Inspector (04:21)
- Element Selection: In Element Selection mode, clicking an element will automatically select it in the Inspector.
Core Takeaways
Add debugging switch to App’s web view
- What to do: Add a switch to the App’s debugging settings page, turn it on and set WKWebView
isInspectable = true- Why it’s worth doing: You can use Safari to check the web content in the app without connecting to Xcode. QA and designers can debug directly - How to start: Set according to the configuration after creating WKWebView
webView.isInspectable = isDebugModeEnabled
Use WebDriver for cross-platform regression testing
- What to do: Use Selenium + Safari WebDriver to write automated tests, covering macOS, iOS simulators and real devices
- Why it’s worth it: WebDriver is a cross-browser standard, and the same set of test scripts can run on Safari, Chrome, and Firefox
- How to start: Install Selenium,
pip install selenium,usewebdriver.Safari()Create driver
Test new CSS features in advance with Feature Flags
- What to do: Enable Preview state features such as CSS Masonry Layout in Safari Technology Preview and adapt in advance
- Why it’s worth it: These features will be enabled by default in the stable version of Safari in about two years. Testing in advance can ensure website compatibility
- How to start: Download Safari Technology Preview, search and enable the target feature in Develop > Feature Flags
Test extreme sizes with Responsive Design Mode
- What to do: Test a viewport size larger than the screen in Safari’s Responsive Design Mode to ensure the layout doesn’t break
- Why it’s worth doing: Users may be using Safari on an external monitor, or zooming windows, and layout quality at extreme sizes is important
- How to start: Develop > Enter Responsive Design Mode, enter super large width and height values, and observe the content rearrangement
Related Sessions
- What’s new in Web Inspector — New features of Web Inspector
- Meet Safari for spatial computing — Safari in spatial computing
- What’s new in CSS — CSS new features
Comments
GitHub Issues · utterances