
Highlight
Instruments has added Hangs templates. Together with Time Profiler and SwiftUI templates, developers can locate three types of performance issues: main thread lagging, asynchronous delay, and main thread blocking, and reduce response delays from hundreds of milliseconds to less than 100 milliseconds.
Core Content
Your app user clicks a button, but the interface hangs for half a second before responding. This experience is like a light bulb that lights up delayed after pressing a switch, immediately breaking the illusion of “real interaction”.
Apple’s research shows that latency below 100 milliseconds is almost imperceptible to discrete interactions (such as clicking a button); latency above 250 milliseconds will be noticeable to users; latency above 500 milliseconds is a real hang. Instruments’ Hangs template marks micro hangs starting at 250 milliseconds, and formal hangs above 500 milliseconds.
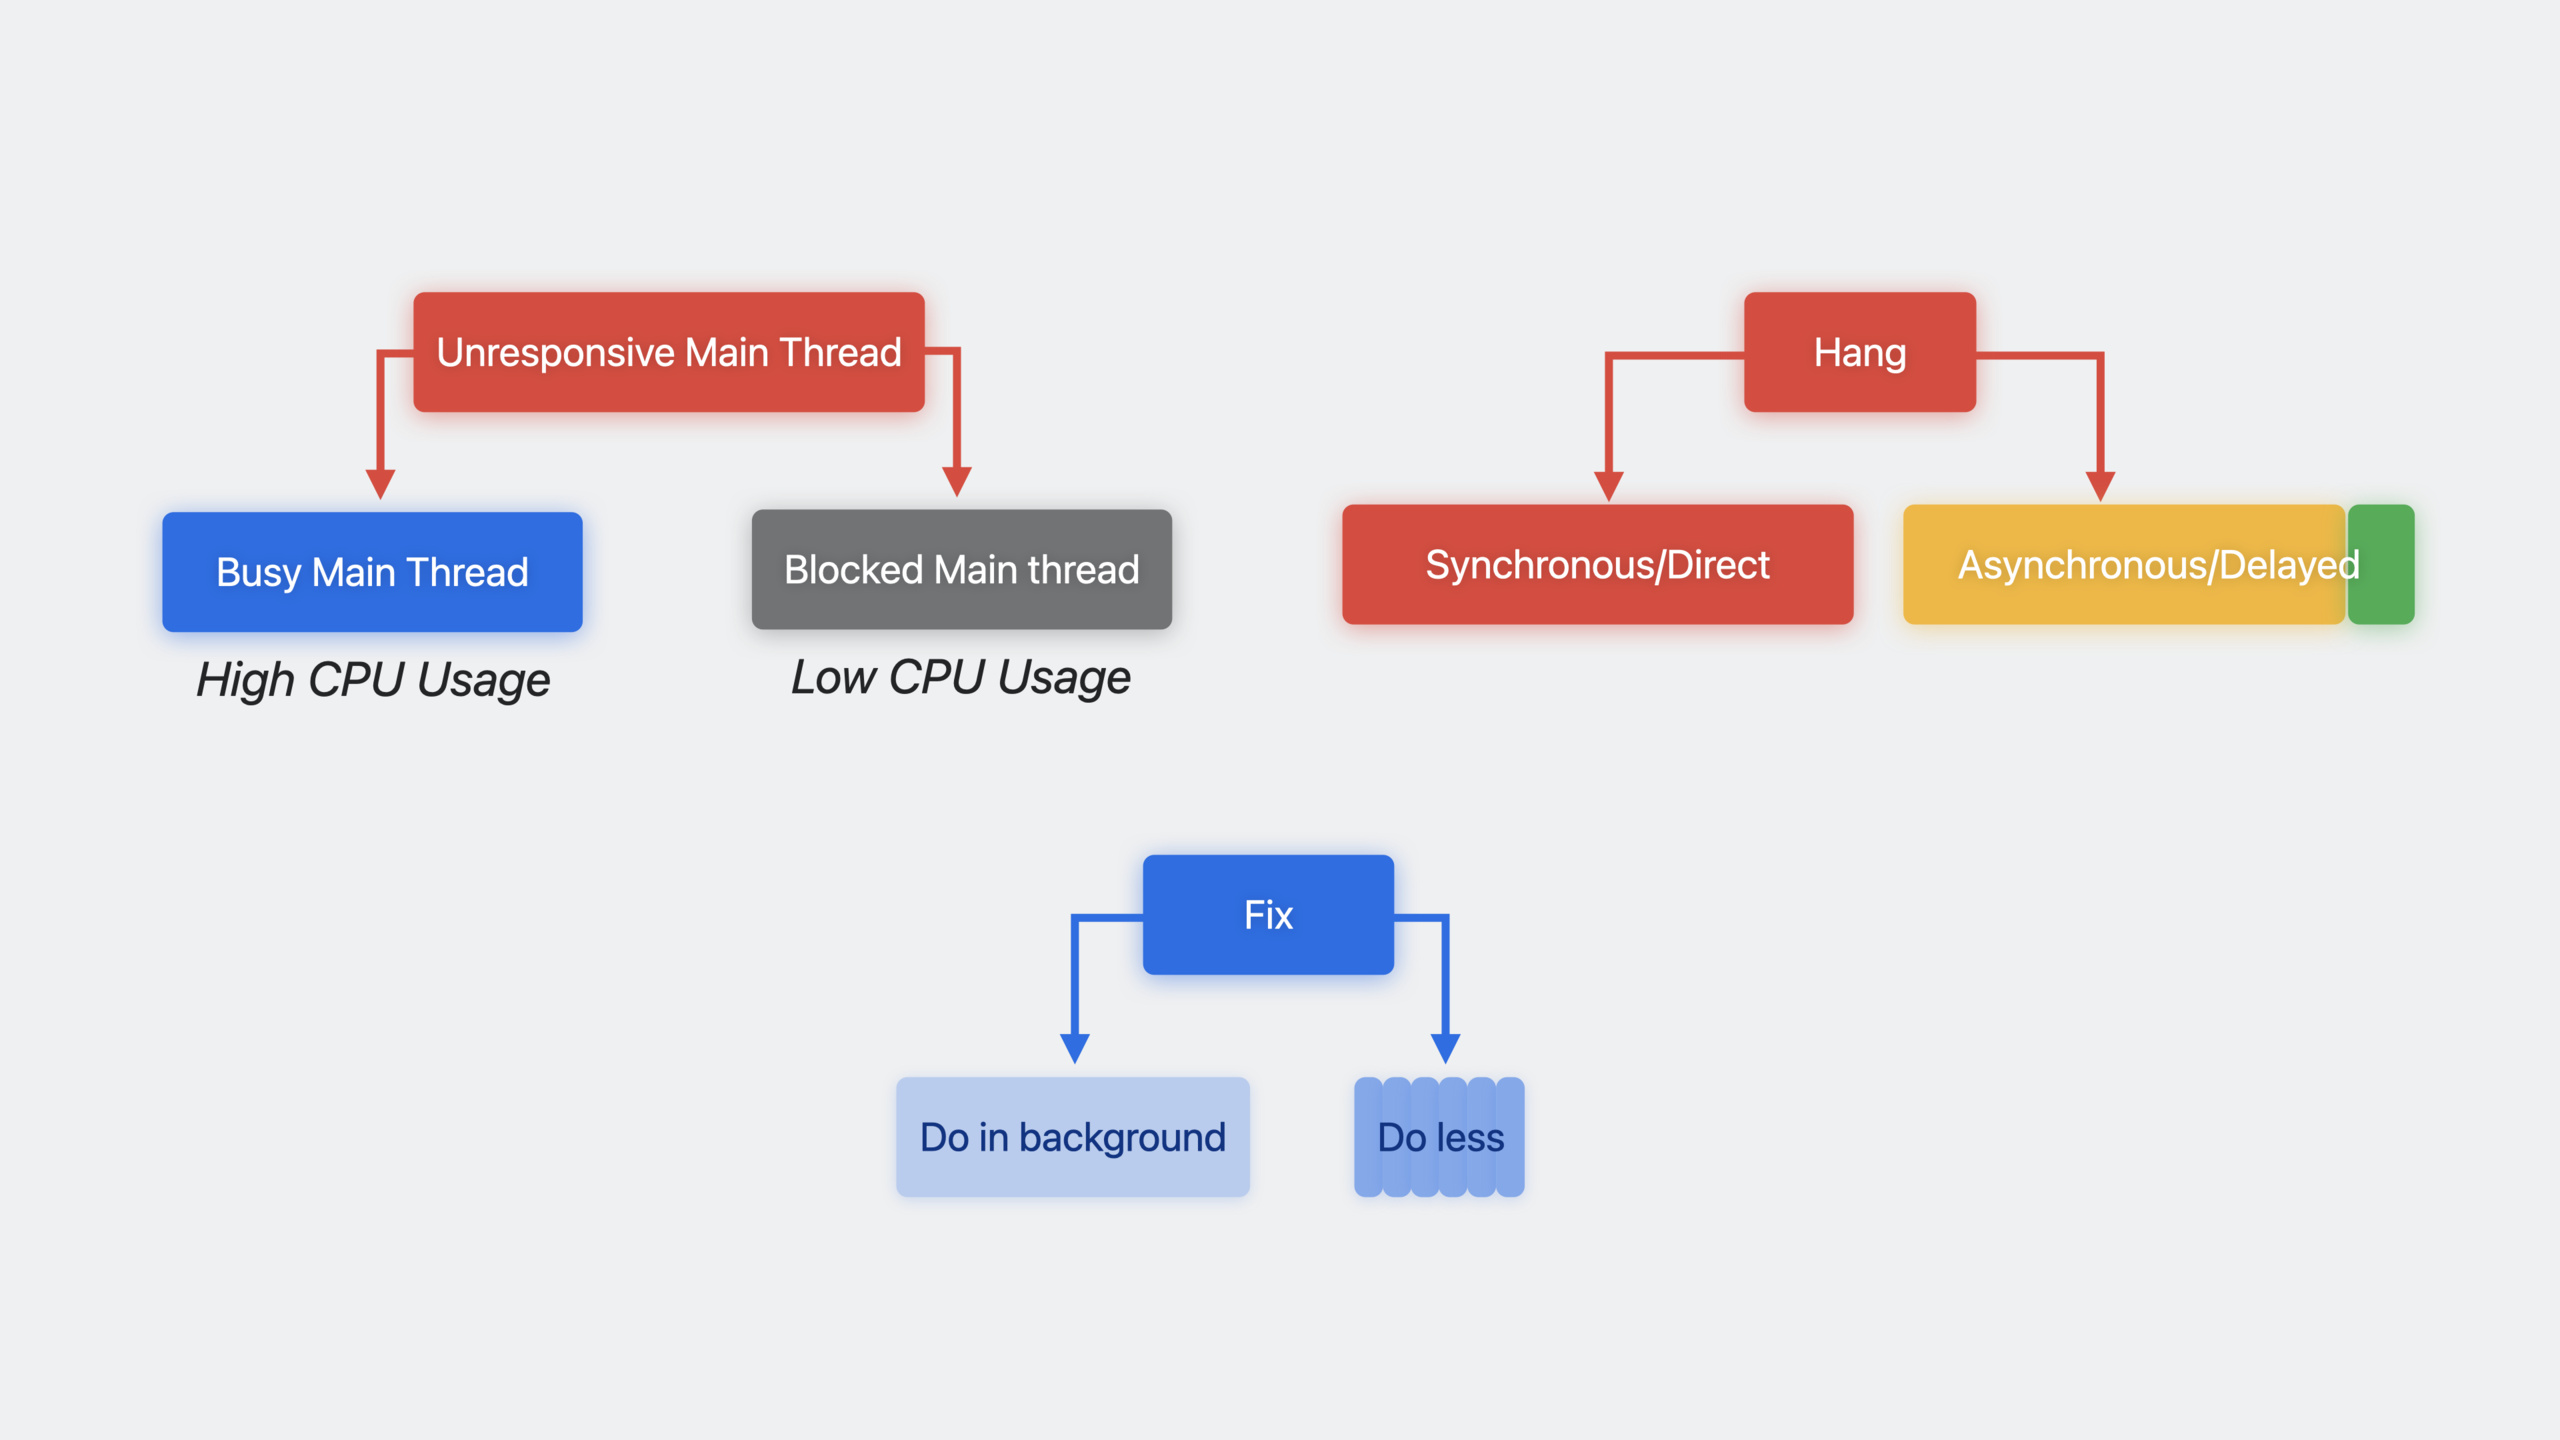
(01:52) After finding a hang, the analysis is usually divided into three steps: identifying the hang type in Instruments, locating the root cause, repairing and verifying. This speech focused on the analysis session and demonstrated three typical hangs.
Main thread busy Hang
(19:38) The speech uses a background selection interface as an example.BackgroundThumbnailViewLoad thumbnails directly and synchronously on the main thread:
struct BackgroundThumbnailView: View {
    static let thumbnailSize = CGSize(width:128, height:128)
    var background: BackyardBackground

    var body: some View {
        Image(uiImage: background.thumbnail)
    }
}
When a large number of thumbnails are displayed simultaneously in the Grid, eachbackground.thumbnailImage decoding and scaling are all performed on the main thread, causing the interface to get stuck.
The fix is to change synchronous loading to asynchronous. Use firstProgressViewTake a seat and pass.taskLoading in the background:
struct BackgroundThumbnailView: View {
    static let thumbnailSize = CGSize(width:128, height:128)
    var background: BackyardBackground
    @State private var image: UIImage?

    var body: some View {
        if let image {
            Image(uiImage: image)
        } else {
            ProgressView()
                .frame(width: Self.thumbnailSize.width, height: Self.thumbnailSize.height, alignment: .center)
                .task {
                    image = await background.thumbnail
                }
        }
    }
}
Key points:
@State private var imageSave the asynchronously loaded image -ProgressView()Show loading indicator before image is ready -.taskModifier automatically executes asynchronous code in the background and refreshes the UI when completed -background.thumbnailChange from sync properties toasyncComputed properties, moving time-consuming operations off the main thread
Asynchronous delayed Hang
(33:40) Even if usingawait, if the background task itself takes too long, the user will still see a long ProgressView. This situation manifests itself in Instruments as: the main thread is not busy, but hangs for a long time.
The solution is to make the calculation of thumbnail asynchronous:
public var thumbnail: UIImage {
    get async {
        // compute and cache thumbnail
    }
}
In this way, decoding and scaling are completed in the background, and the main thread is only responsible for displaying the results.
Main thread blocking Hang
(38:52) The most hidden category. The code looks like it usesawait, but subsequent code still blocks the main thread:
class ColorizingService {
    static let shared = ColorizingService()
    func colorize(_ grayscaleImage: CGImage) async throws -> CGImage
}

struct ImageTile: View {
    var body: some View {
        mainContent
            .task {
                let colorizer = ColorizingService.shared
                result = try await colorizer.colorize(image)
            }
    }
}
The problem isColorizingService.sharedyes@MainActorsynchronization properties on. Althoughcolorizeyesasync, but accesssharedIt will block the main thread itself. Even more insidiously, even if written asawait ColorizingService.shared.colorize(image),sharedSynchronous access still occurs onawaitBefore.
The fix is to avoid accessing the synchronized singleton on the main thread. The singleton reference can be obtained in advance, or refactored into an initialization method that does not rely on the main thread.
Detailed Content
Use Instruments to analyze Hang
(01:52) In Xcode 15, select Product > Profile, and then select the Hangs template. After recording the app running, Instruments will mark all hang intervals that exceed the threshold.
The timeline area is marked with a red bar, and below is the activity of each thread. Click on a hang interval, and the details panel below will display the call stack of each thread in that time period.
Identification features of three types of Hang
| Hang type | Main thread status | Identification method |
|---|---|---|
| Main thread busy | 100% CPU | Time Profiler shows the main thread executing your code |
| Asynchronous delay | Idle, waiting | Hang duration is long, main thread has no activity |
| Main thread blocked | Idle but blocked | Call stack stalled on synchronization lock or actor-isolated code |
Grid vs LazyVGrid choice
(20:26) The speech also comparedGridandLazyVGridperformance difference.Gridwill create all subviews at once, whereasLazyVGridOnly created in visible areas. For large amounts of data, useLazyVGrid:
ScrollView {
    LazyVGrid(columns: [.init(.adaptive(minimum: BackgroundThumbnailView.thumbnailSize.width))]) {
        ForEach(BackyardBackground.allBackgrounds) { background in
            BackgroundThumbnailView(background: background)
        }
    }
}
Key points:
LazyVGridCreate a view only when the cell enters the visible area -.adaptive(minimum:)Automatically calculate the number of columns to adapt to different screen widths- Cooperate with asynchronous loading to avoid centralized lag during the first display.
Combine with other Instruments templates
(00:55) The Hangs template tells you “where it is stuck”, but to know “why it is stuck”, you often need to add other templates:
- Time Profiler: View the CPU usage of each thread
- SwiftUI: Analyze the execution time of the view body
- Disk Activity: Check if there is synchronous I/O blocking the main thread
- Network: Confirm whether the delay comes from network requests
Core Takeaways
-
What to do: Add asynchronous image loading to each list interface of the App
-
Why it’s worth doing: The most sensitive thing when users slide the list is the image loading lag. use
ProgressView+.task+asyncAttribute, you can completely move the image decoding out of the main thread -
How to start: Find the code that loads images directly and synchronously in the list, and change the loading logic to
asyncComputed properties, used in view layer.tasktrigger -
What to do: Create a “Hangs + Time Profiler” combination template in Instruments and release the profile regularly
-
Why is it worth doing: Many hangs are not obvious in the development environment because the amount of data is small and the device performance is good. Recording real user scenarios can expose problems
-
How to start: Product > Profile, select the Hangs template, click the red hang bar after recording, and then add Time Profiler to view the call stack
-
What to do: Audit the singleton pattern in the code and check if there is
@MainActorSynchronous properties are accessed frequently -
Why it’s worth doing:
static let sharedCooperate@MainActorIt is a hidden trap where the main thread is blocked. Even if subsequent code is usedawait, the synchronization operation to access the singleton itself has been blocked. -
How to get started: Global search
.shared, check its actor isolation properties. in the case of@MainActor, consider changing to non-isolated initialization or caching references ahead of time -
What to do: Use
LazyVGridorLazyVStackReplace loading large amounts of data at onceGrid/VStack- Why is it worth doing: When the list has 2000 pieces of data,ForEach2000 views will be created.LazySeries are only created in the visible area, greatly reducing the initial loading pressure -
How to start: Check all usage
Grid、VStack+ForEachList code to evaluate whether the data volume is suitable for changing to Lazy version
Related Sessions
- Track down hangs with Xcode and on-device detection — WWDC22 course, explaining how to detect hangs before and after release
- Demystify SwiftUI performance — SwiftUI performance analysis, used with Instruments
- What’s new in Xcode 15 — New features in Xcode 15, including improved Instruments and Hangs templates
- Swift concurrency: Behind the scenes — In-depth understanding of Swift Concurrency’s threading model to help diagnose blocking caused by actor isolation
Comments
GitHub Issues · utterances