
Highlight
The new Debug Console of Xcode 15 takes log messages as the core and displays metadata on demand. Together with token filtering and LLDB’s DWIM Print, developers can greatly improve the efficiency of locating problems from massive logs.
Core Content
What are you most afraid of when debugging? The console isprintThe output is flooded, and it takes a long time to find a key log. To make matters worse, there is a problem with the production environment, and the logs on the user’s device cannot be obtained at all.
Xcode 15 solves this problem on three levels: a redesigned Debug Console, smarter LLDB expression evaluation, and Unified Logging best practices.
New version of Debug Console
In the old version of the console, each log is preceded by a large string of metadata (timestamp, process ID, thread ID, etc.), and the really important message content is squeezed to the back. (01:02)
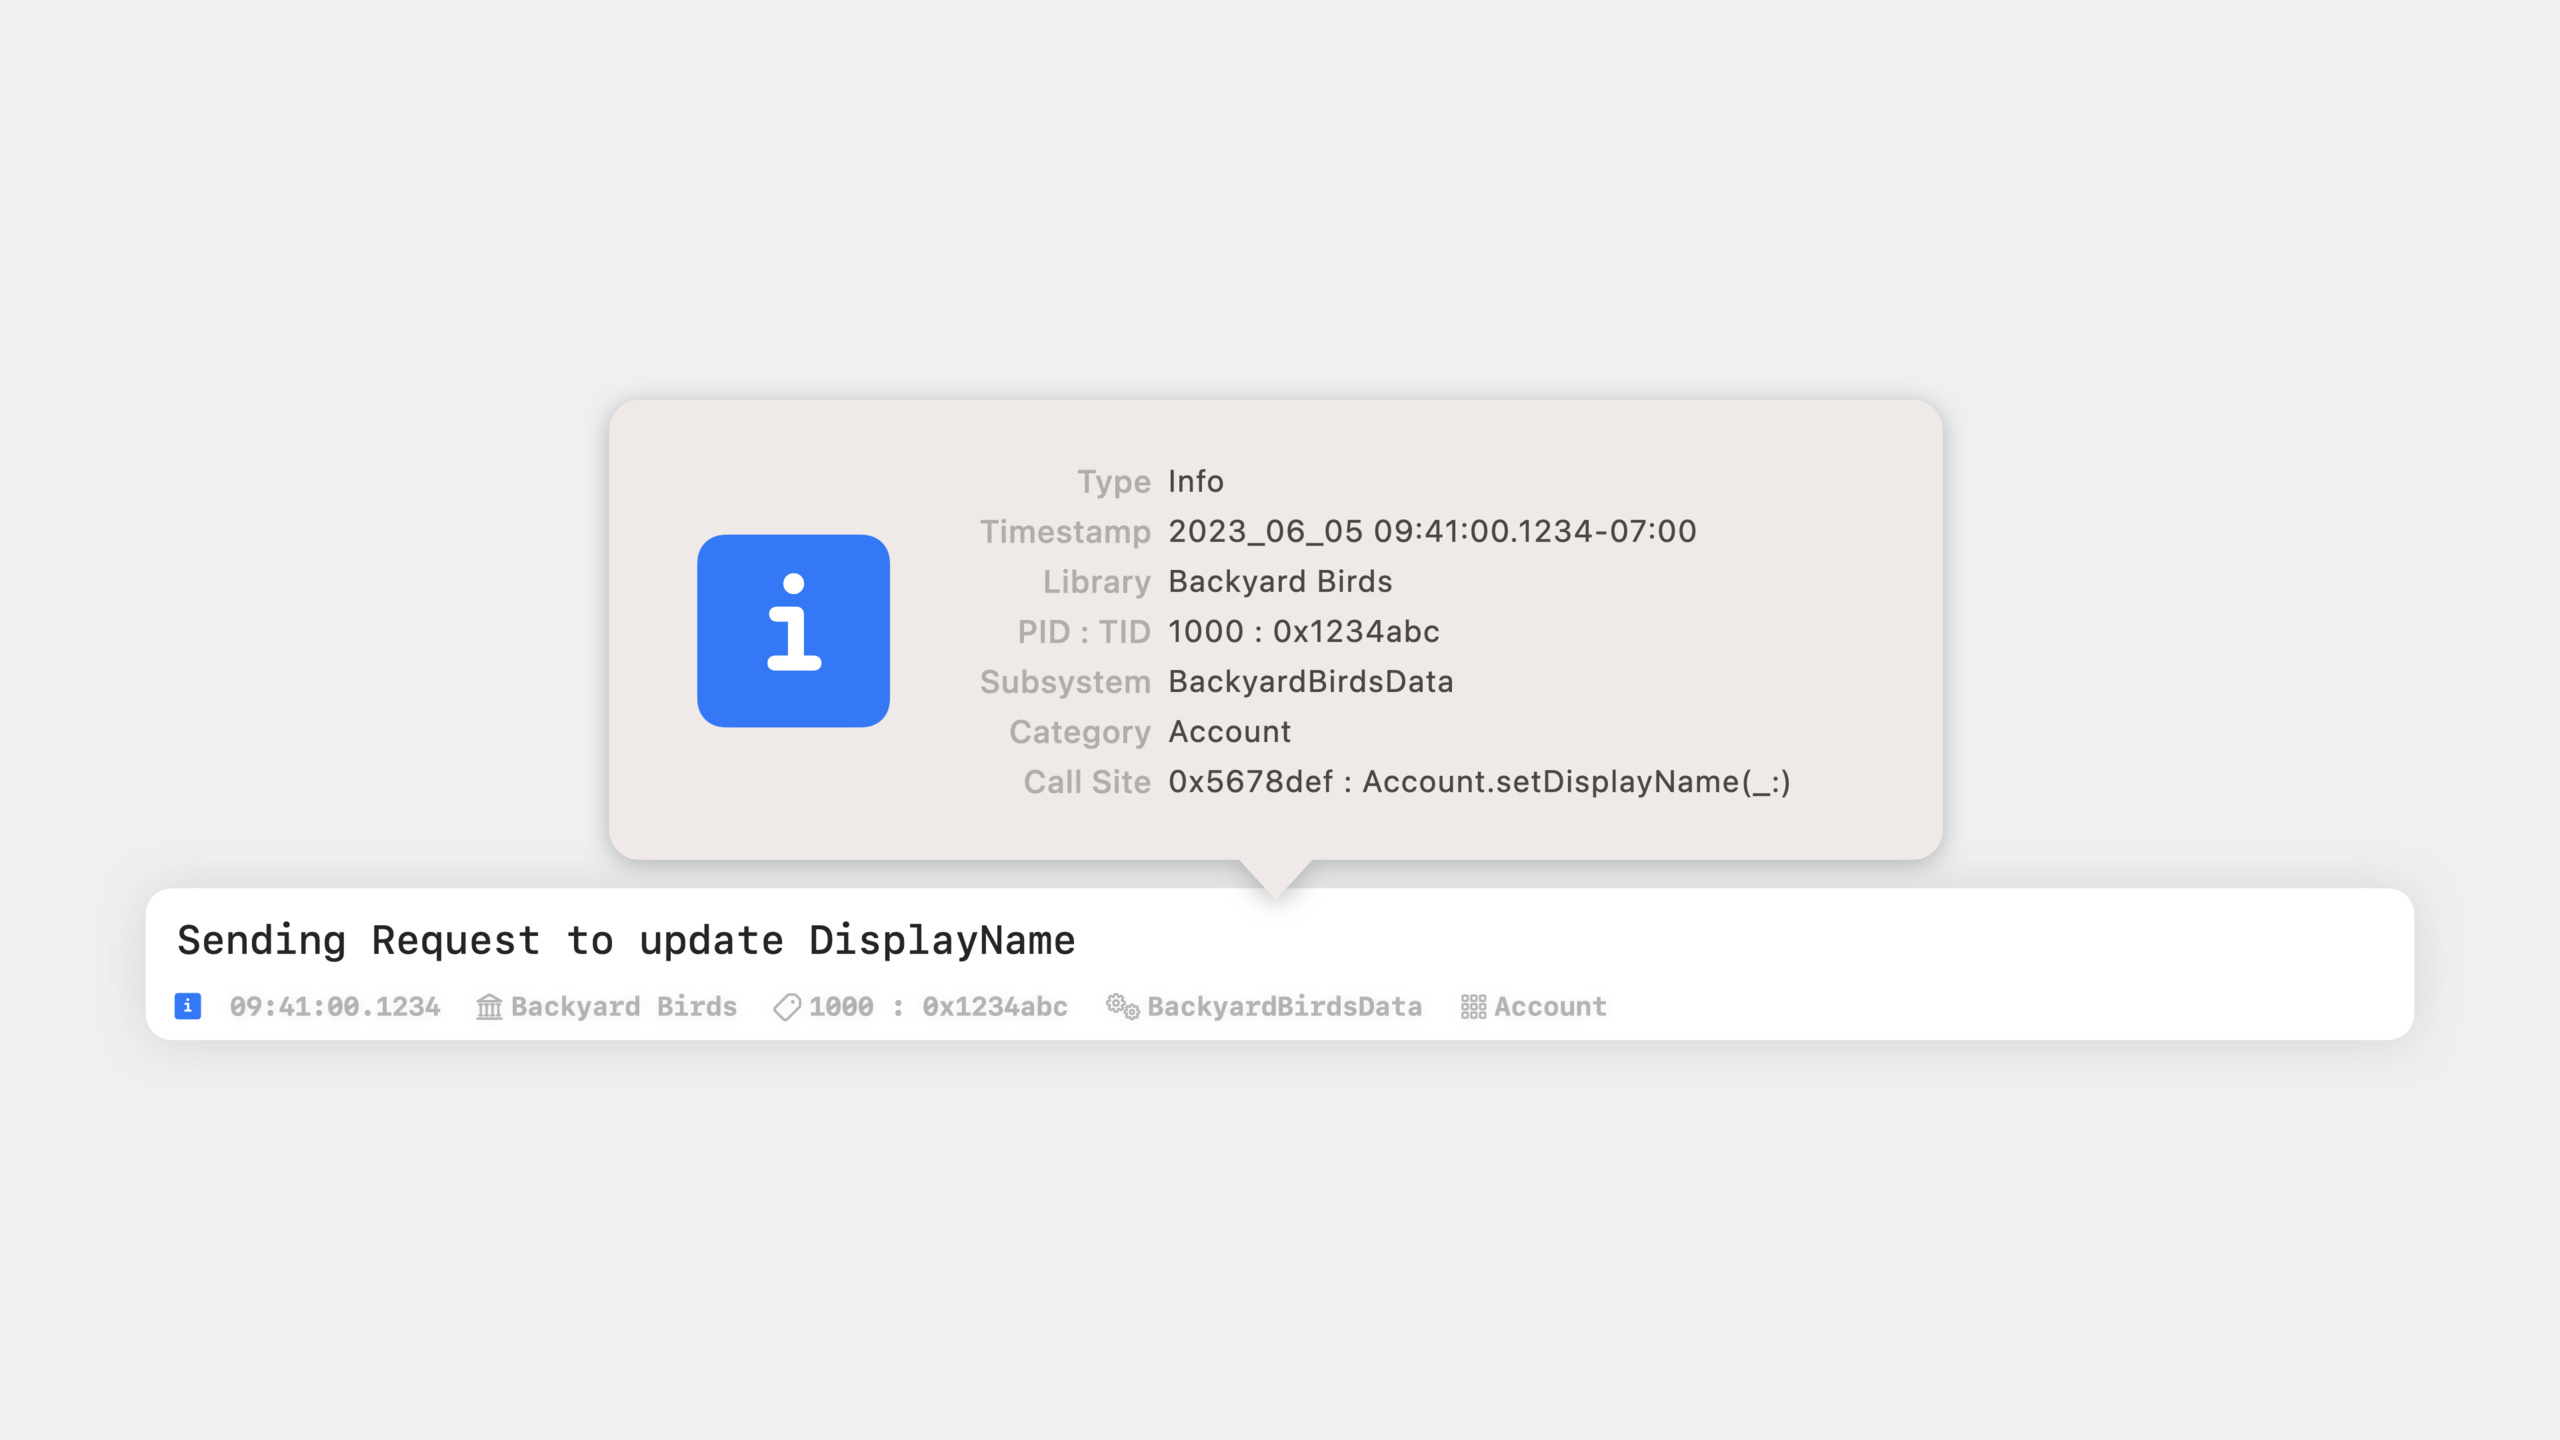
The new version hides metadata by default and only displays the message itself written by the developer. When you need to see metadata, click the options button in the lower left corner to open it as needed. You can also select a single log and press Space to Quick Look to view the complete information in the pop-up window, including the function name and source code location that calls the log.
Error and fault level logs will be highlighted with yellow and red backgrounds, allowing you to locate serious problems at a glance.
Token filtering
Filtering is a core capability of the new Debug Console. (02:16)
When typing in the filter field, auto-completion will prompt available filter dimensions: subsystem, category, type, library, etc. After selecting, enter the filter value. Multiple conditions can be used in combination.
In addition to manual input, there are three shortcuts:
- Filter Menu: Directly select the log type to be displayed (debug, info, error, fault, etc.)
- Right-click menu: Select “Hide Similar” or “Show Only Similar” for a certain log to automatically generate filter conditions
- Category filtering: After entering keywords, select the category dimension to quickly focus on specific modules.
Practical combat: Use logs to locate bugs
Session used a real case to demonstrate this workflow: after a user updated their personal information, the changes were not saved. (03:35)
The steps are as follows:
- Recurring problem: Modify the display name, exit the page and re-enter, and find that the modification is lost.
- Enter “account” in the Debug Console, select the category filter dimension, and only keep account-related logs
- Find the “Requesting to change displayName” log, hover it and click the source code location in the lower right corner to jump directly to the code that issued the log.
- Enter
setDisplayNamefunction and found that the code only updated the database and did not update the local cache. - Fix: add after database update
account.displayName = newDisplayName
The entire positioning process takes less than two minutes. The key is that the log is written in the correct position so that the filter can be accurately hit.
DWIM Print for LLDB
When debuggingpoandpWhich one to use? Many people choose based on their feelings, and often end up getting a memory address without any information. (06:35)
Xcode 15 introduces Do What I Mean Print (DWIM).pThe command will now intelligently determine the expression type and automatically select the fastest evaluation method:
- Basic types (Int, String, etc.) print values directly
- Structures and classes print attribute lists first
- realized
CustomStringConvertibleThe object prints a custom description
pois equivalent topPlus enforced object description mode. In most cases, usepThat’s enough.
Need to remember the pastp、po、v、vo、expression、frame variableThe scenario of waiting for multiple commands is now simplified to two.
Migrate from print to OSLog
printThere are several shortcomings: no log level, no structured metadata, cannot be collected in the production environment, and performance overhead is uncontrollable. (09:18)
OSLog solves all these problems. The migration process is simple:
import OSLog2. Create Logger:let logger = Logger(subsystem: "BundleID", category: "ComponentName")3. uselogger.info()、logger.error()Wait for replacementprint
Subsystem usually uses Bundle Identifier, and category uses class name or module name. In this way, you can directly locate by module when filtering.
Detailed Content
Log level selection
OSLog provides five levels, in increasing severity:
debug: Development and debugging information, not stored to disk by default -info: General information such as operation started/completed -notice: Events that require attention, default level -error: Error, need investigation -fault: Serious failure, system level problem
import OSLog

let logger = Logger(subsystem: "com.example.MyApp", category: "Account")

func login(password: String) -> Error? {
    var error: Error? = nil
    logger.info("Logging in user '\(username)'...")

    // ... validation logic ...

    if let error {
        logger.error("User '\(username)' failed to log in. Error: \(error)")
    } else {
        logger.notice("User '\(username)' logged in successfully.")
    }
    return error
}
Key points:
LoggerIt is a value type and can be created globally or on demand.- subsystem and category are strings used for filtering in the Debug Console
- Log messages support string interpolation, but complex objects require
\(object, privacy: .public)Control privacy level - By default, dynamic strings are marked as private to protect user data
Code comparison before and after bug fix
Before restorationsetDisplayNameOnly the database is updated, not the local model:
public func setDisplayName(_ newDisplayName: String) {
    logger.info("Sending Request to update DisplayName")
    Database.setValueForKey(Database.Key.displayName, value: newDisplayName, forAccount: account.id)
    logger.info("Updated DisplayName to '\(newDisplayName)'")
}
Added local cache update after fix:
public func setDisplayName(_ newDisplayName: String) {
    logger.info("Sending Request to update DisplayName")
    Database.setValueForKey(Database.Key.displayName, value: newDisplayName, forAccount: account.id)
    account.displayName = newDisplayName  // Added
    logger.info("Updated DisplayName to '\(newDisplayName)'")
}
Key points:
- Logs are written before and after the operation to form a complete call link
- Pass
logger.infoRecord the two status points “Sending Request” and “Updated” - Use LLDB after repair
p accountVerify that local properties have been updated
LLDB debugging verification
Breakpoint on the fixed code and verify with LLDB:
(lldb) p account
(BackyardBirdsData.Account) =0x000060000223b2a0 {
    id = 3A9FC684-8DFC-4D7D-B645-E393AEBA14EE
    joinDate = 2023-06-05 16:41:00 UTC
    displayName = "Sample Account"          // Before the fix: old value
    emailAddress = "[email protected]"
    isPremiumMember = true
}

// After executing account.displayName = newDisplayName

(lldb) p account
(BackyardBirdsData.Account) =0x000060000223b2a0 {
    ...
    displayName = "Johnny Appleseed"        // After the fix: new value
    emailAddress = "[email protected]"
    ...
}
Key points:
pStruct and class properties are now automatically expanded- If not customized
CustomStringConvertible,poOnly the object address will be output - use
pAs the default debugging command,poUse only if you need a custom description
Production environment log collection
The OSLogStore API can read system logs while the app is running and can be used to diagnose problems reported by users:
import OSLog

do {
    let store = try OSLogStore(scope: .currentProcessIdentifier)
    let position = store.position(timeIntervalSinceLatestBoot: 0)
    let entries = try store.getEntries(at: position)

    for entry in entries {
        if let logEntry = entry as? OSLogEntryLog {
            print("[\(logEntry.subsystem)] \(logEntry.composedMessage)")
        }
    }
} catch {
    logger.error("Failed to read log store: \(error)")
}
Key points:
OSLogStoreRequires iOS 15+/macOS 12+ -.currentProcessIdentifierOnly read the log of the current process -composedMessageis the complete log message containing all interpolation results- Can be combined
predicateFilter on a specific subsystem or category
Core Takeaways
1. Log specifications that prioritize diagnosability What to do: Establish logging specifications in the team, requiring each module to use an independent Logger category, and logging must be done before and after key operations. Why it’s worth doing: Good log specifications can reduce the time to locate online problems from hours to minutes. How to start: Create a set of global Loggers when the App starts, classified by modules (Network, Database, UI, Account). Use SwiftLint rules or Code Review checklists to ensure compliance.
2. Built-in diagnostic reporting function
What to do: Add an “Export diagnostic log” button to the App settings. When users encounter problems, they can collect recent operation logs and send them to developers with one click.
Why it’s worth doing: OSLogStore makes production environment log collection feasible, eliminating the need to rely on verbal descriptions that are difficult to reproduce.
How to start: UseOSLogStoreRead the logs of the last 10 minutes, filter out the subsystem of this App, package it into a text file and send it through email or upload interface.
3. Automated log assertion testing
What to do: Verify in unit tests that the critical path produces the expected logs.
Why it’s worth doing: Logs are subject to decay just like code, and testing ensures logs aren’t lost as you refactor.
How to start: UseOSLogStoreCapture logs before and after test execution to assert whether specific messages are present. Or encapsulate a log middleware and write the log to the memory array in test mode for assertion use.
4. Performance-sensitive Signpost tracking
What to do: useos.signpostMark the start and end points of key operations to visually analyze performance bottlenecks in Instruments.
Why it’s worth doing: OSLog and Signpost share the same infrastructure, so logging and performance analysis can be seamlessly connected.
How to start: UseOSSignposterInstead of manual timing, insert begin/end tags before and after network requests, database queries, image decoding and other operations. Select the Logging template in Instruments to view the timeline.
Related Sessions
- Explore logging in Swift — An in-depth introduction to the Swift logging system, including privacy controls and log storage
- Measure performance using Logging — Use OSLog Signpost for performance measurement and analysis
- Debug with Instruments — Detailed explanation of Instruments debugging tool, used in conjunction with the log system
Comments
GitHub Issues · utterances