
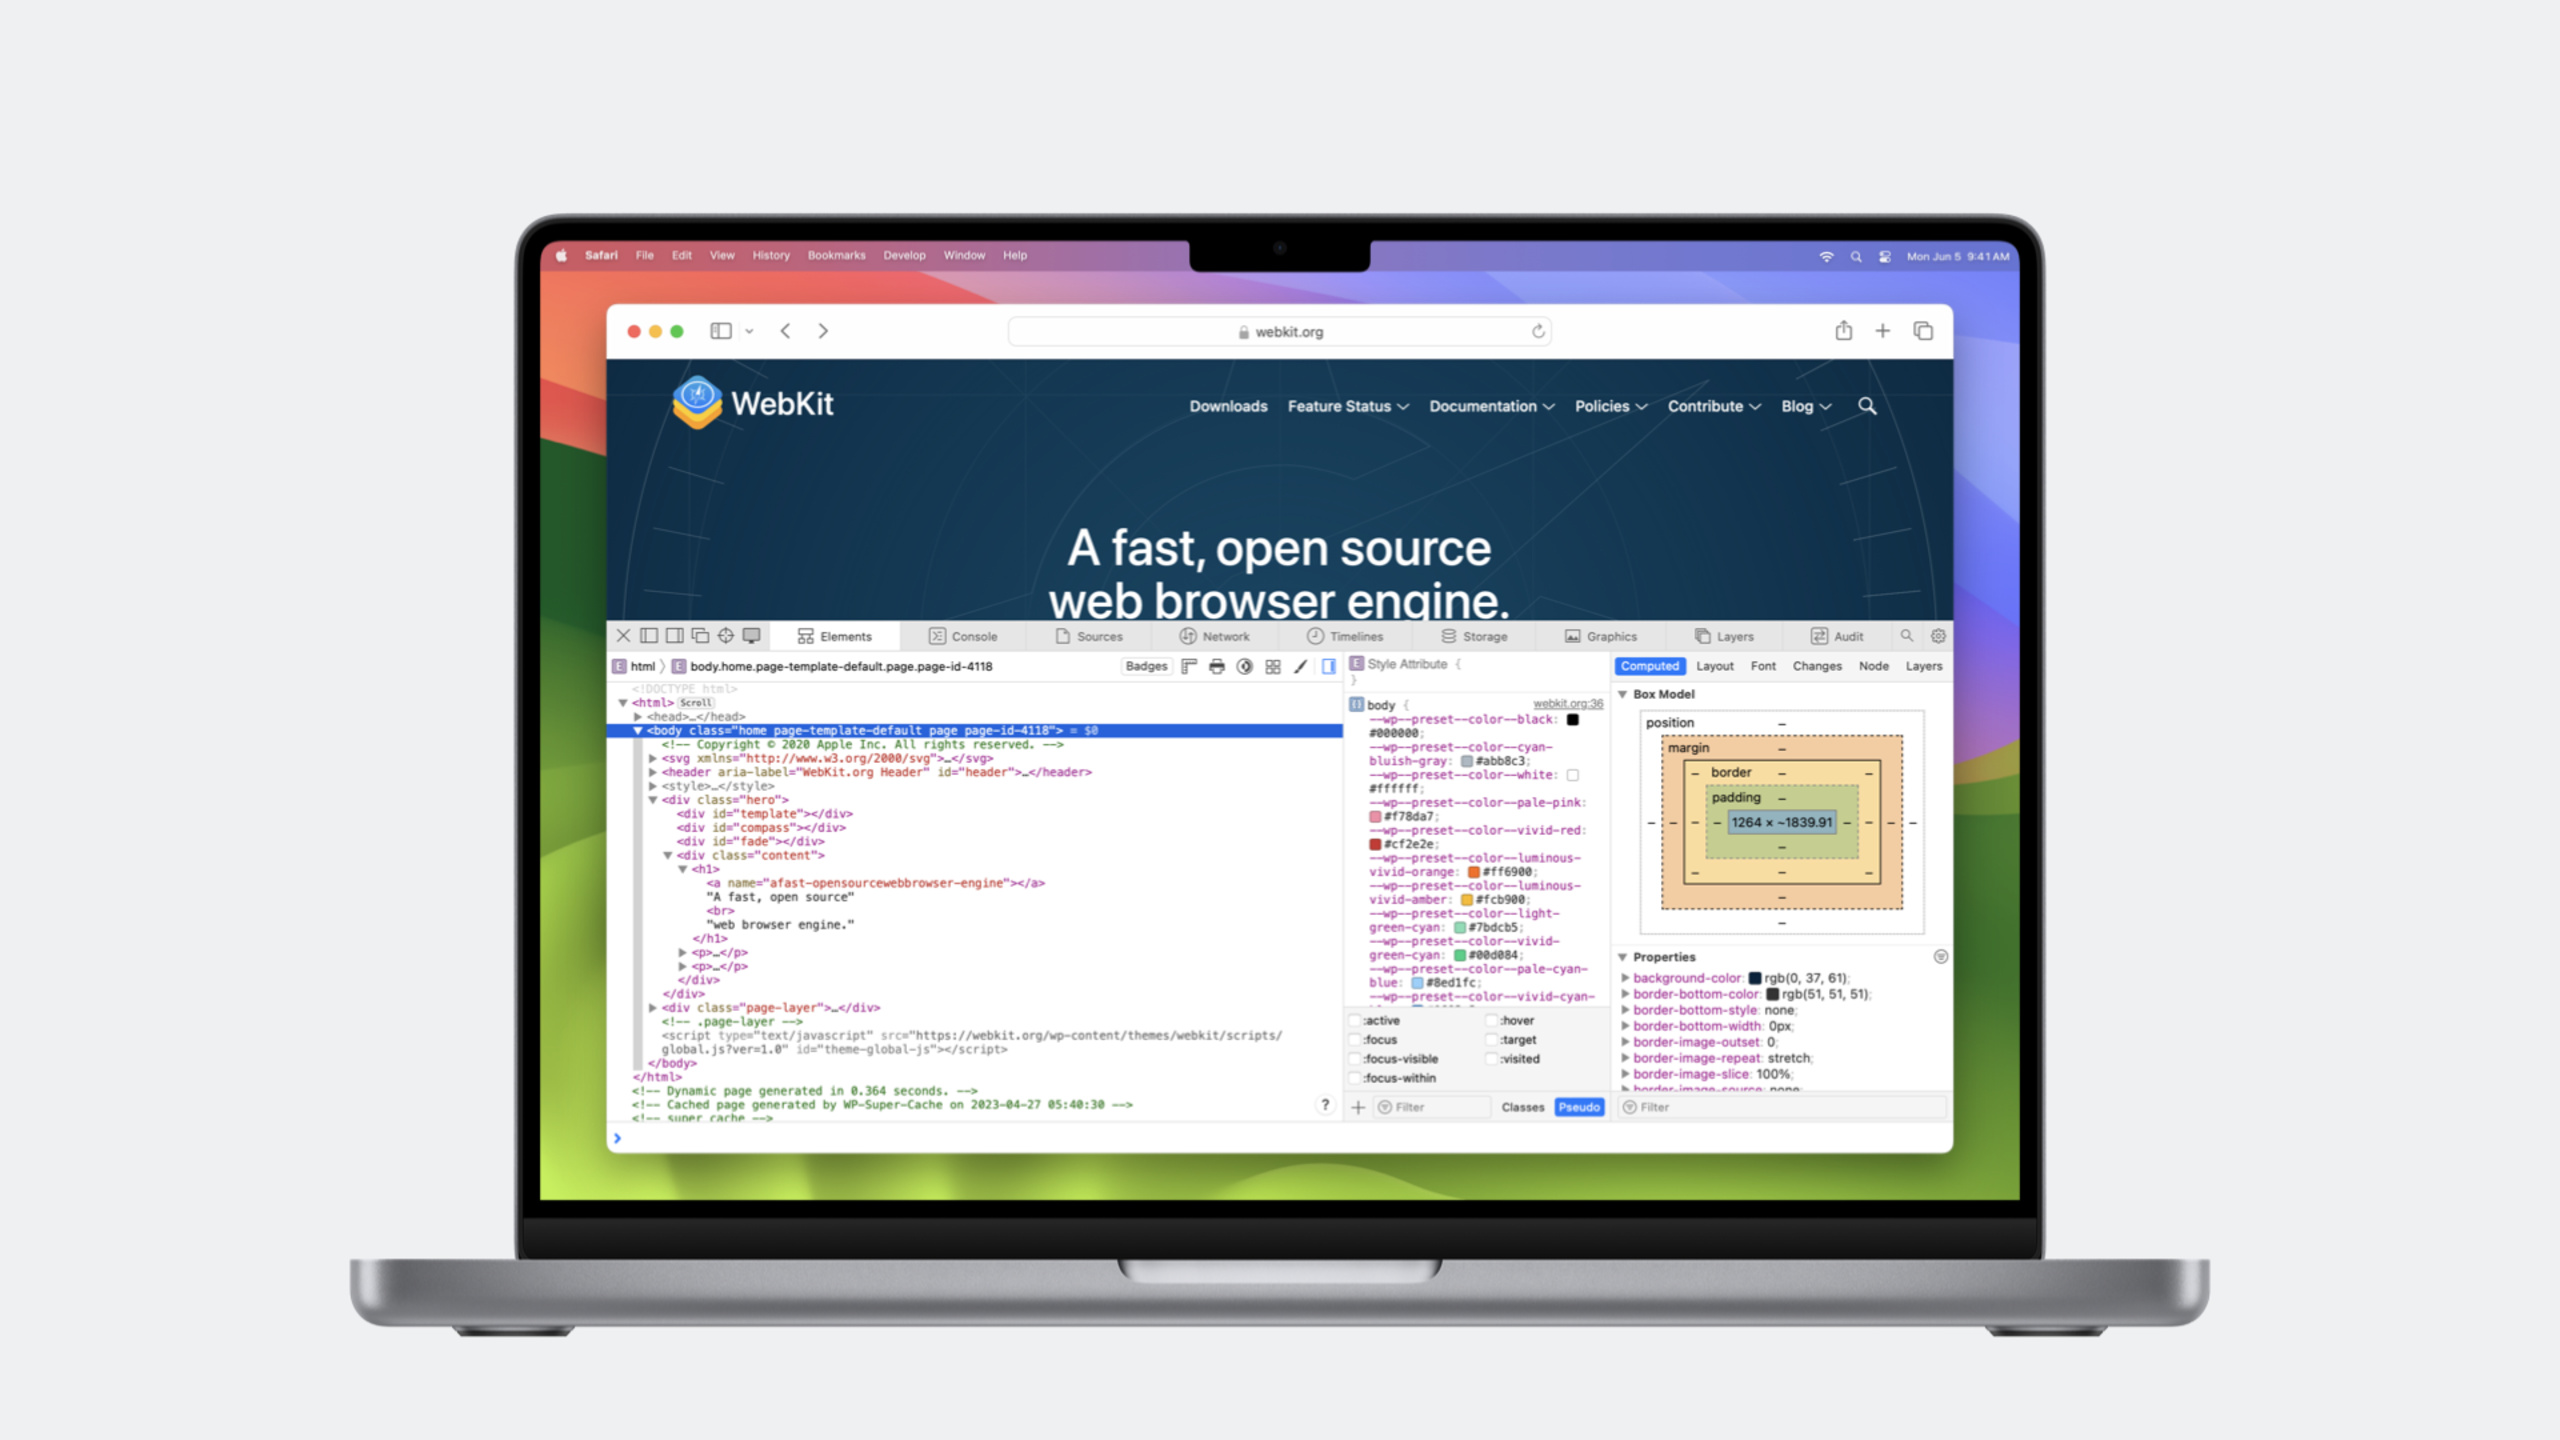
Highlight
Safari Web Inspector adds interactive controls for variable fonts, warnings for synthesized styles, user preference overrides, scroll container and event listener badges, and Symbolic Breakpoints—making front-end debugging more intuitive from typography to accessibility to JavaScript breakpoints.
Core Content
Typography Inspection
Front-end developers often run into font-related questions: Why does this text not look bold enough? Why does the italic look odd? Which font file is actually loaded?
The Font panel in the Details sidebar of the Elements tab in Web Inspector answers these questions. It shows the primary font name used by the selected element, basic properties (size, style, weight, stretch), and font features (ligatures, small caps, number styles, and more).
(02:49)
An important warning was added this year: synthesized bold and synthesized italic. When a font file lacks a true bold or italic variant, WebKit simulates them algorithmically—bold by thickening strokes, italic by slanting upright glyphs. Type designers spend significant time drawing dedicated italics, which often have a cursive feel and look very different from a mechanical slant. Web Inspector now labels synthesized styles in the Font panel, suggesting you may need to load the corresponding font files.
(03:53)
Variable fonts are another focus. A single variable font file can contain all the information for multiple stylistic variations, such as weight, width, and slant. Each variation axis provides a continuous range of values rather than the few discrete steps found in static font files.
This year Web Inspector adds interactive controls for variable fonts. When you select an element using a variable font, the Font panel lists all available variation axes (such as wght, wdth, and GRAD), each with a slider you can adjust in real time. As you drag a slider, the text on the page updates immediately and the corresponding CSS value is written into the Styles panel.
(06:59)
User Preference Simulation
Testing how a site behaves under different accessibility settings used to require changing system settings. That affected all of macOS, not just the page under test.
Web Inspector now includes a User Preference Overrides popover. Click the new icon in the Elements tab to override user preferences for the currently inspected page, including:
- Color Scheme: simulate
prefers-color-schemelight/dark - Reduce Motion: simulate
prefers-reduced-motion - Increase Contrast: simulate
prefers-contrast
These overrides take effect only while Web Inspector is open and do not affect the rest of the system.
(10:28)
Element Badges
Flex and Grid containers in the DOM tree in the Elements tab already had badge indicators. Two more were added this year:
- Scroll badge: marks containers whose content overflows and scrolls. This is especially useful on systems where scrollbars are hidden by default, helping you quickly spot unexpected horizontal scrolling.
- Event badge: marks elements with JavaScript event listeners attached. Click the badge to see a list of all listeners, including event type, handler name, source location, configuration options (bubbling, once, and so on), and you can disable listeners or set event breakpoints.
(15:52)
Breakpoint Enhancements
JavaScript breakpoints gained Symbolic Breakpoints this year. Unlike setting a breakpoint on a specific line of code, a Symbolic Breakpoint pauses execution just before a specified function is called.
You can match a function name exactly or use a regular expression to match multiple functions. This is especially useful when debugging calls to built-in JavaScript APIs (such as navigator.share()) or when searching for functions with the same name.
(23:22)
Breakpoints can also be configured to auto-continue. Combined with Log Message or Evaluate JavaScript actions, this is equivalent to injecting console.log() or modifying variable values without pausing.
Detailed Content
Using Variable Fonts in CSS
Variable fonts are controlled through @font-face font-variation-settings or standard CSS properties.
@font-face {
  font-family: "Inter";
  src: url("Inter-Variable.woff2") format("woff2-variations");
  font-weight: 100 900;
  font-stretch: 75% 125%;
}

body {
  font-family: "Inter", sans-serif;
  font-weight: 450;
}

/* Bold in dark mode */
@media (prefers-color-scheme: dark) {
  body {
    font-weight: 500;
  }
}
Key points:
font-weight: 100 900in@font-facedeclares the supported weight range for that fontfont-stretch: 75% 125%declares the width variation range- With a variable font, non-round values like
font-weight: 450are valid - Static fonts only support round hundreds: 100, 200, 300…900
How to interact with variable fonts in Web Inspector:
/* After adjusting sliders in the Styles panel, CSS like this is generated */
.title {
  font-family: "Inter";
  font-weight: 680;
  font-stretch: 95%;
  font-variation-settings: "GRAD" 150;
}
Key points:
font-variation-settingscontrols custom variation axes (such as"GRAD")- The
GRAD(Grade) axis changes perceived weight without changing character width, useful for fine-tuning contrast in responsive layouts - Prefer
font-weightandfont-stretchfor standard axes rather thanfont-variation-settings
CSS Adaptation for User Preference Overrides
/* Base animation */
.photo-zoom {
  animation: zoom-in 0.3s ease-out;
}

@keyframes zoom-in {
  from { transform: scale(0.8); opacity: 0; }
  to { transform: scale(1); opacity: 1; }
}

/* Alternative for users who prefer reduced motion */
@media (prefers-reduced-motion: reduce) {
  .photo-zoom {
    animation: fade-in 0.5s ease-out;
  }
}

@keyframes fade-in {
  from { opacity: 0; }
  to { opacity: 1; }
}
Key points:
prefers-reduced-motiondetects whether the user has enabled reduced motion- Do not remove all animation outright—use gentler animation instead
- Removing animation entirely can hurt usability because motion communicates interface changes
- Enable Reduce Motion in User Preference Overrides to test this code
Dark mode adaptation:
.card {
  background: #ffffff;
  color: #1a1a1a;
  border: 1px solid #e0e0e0;
}

@media (prefers-color-scheme: dark) {
  .card {
    background: #1a1a1a;
    color: #f0f0f0;
    border-color: #404040;
  }
}
Key points:
prefers-color-scheme: darkmatches system dark mode- Switch the Color Scheme override in Web Inspector to preview instantly
- Icon colors also change with the override state, making it easy to confirm the active color scheme
Using Symbolic Breakpoints
Set a Symbolic Breakpoint in the Sources tab:
// Suppose your code calls navigator.share() somewhere
// but the shared URL is wrong and you want to find the call site

// In the Sources tab of Web Inspector:
// 1. Click the + button in the Breakpoints area
// 2. Choose "Symbolic Breakpoint"
// 3. Enter the function name: navigator.share
// 4. Set the breakpoint

// When the share button is clicked, execution pauses before navigator.share() is called
// You can then inspect the Call Stack to find the call site in your code

// Fix the issue automatically with breakpoint actions:
// Set a regular breakpoint at the call site, right-click to edit:
// - Uncheck "Pause" (enable Auto-continue)
// - Add Action: Evaluate JavaScript
// - Enter: data.url = "https://example.com/photo/" + photoId;
Key points:
- Symbolic Breakpoints match function names without needing the exact source location
- Regular expressions are supported, e.g.
/share.*/matches all functions starting with share - Combined with Auto-continue and Evaluate JavaScript actions, you can fix runtime data without pausing
- The Call Stack traces back to the call site in your application code
Event Listener Badge Workflow
<!-- HTML structure -->
<div class="gallery">
  <figure class="photo" data-id="123">
    <img src="photo.jpg" alt="...">
    <button class="share-btn">Share</button>
  </figure>
</div>
// JavaScript event binding
document.querySelector('.gallery').addEventListener('click', handlePhotoClick);
document.querySelector('.share-btn').addEventListener('click', handleShare, { once: true });In Web Inspector:
- The
.galleryelement shows an Event badge; clicking it reveals theclicklistener - The
.share-btnEvent badge shows the{ once: true }configuration - You can temporarily disable a listener to troubleshoot event conflicts
- You can set an event breakpoint directly from the badge to pause on the next trigger
Key points:
- Event badges show all listeners, including events captured during the bubbling phase
- You can distinguish
addEventListenerfrom inlineonclickbindings - Disabling a listener is temporary and resets after a page reload
- Event breakpoints pause before the handler runs when the event fires
Core Takeaways
1. Replace multi-file font stacks with variable fonts
- What to do: Replace multiple font files for different weights (Regular, Medium, Bold) with a single variable font file
- Why it matters: Fewer HTTP requests, continuously adjustable weight and width, and Web Inspector’s interactive controls make fine-tuning intuitive
- How to start: Choose a variable font (such as Inter or Roboto Flex), declare ranges in
@font-face, drag sliders in Web Inspector to find the best values, then copy the CSS
2. Build an accessibility adaptation checklist
- What to do: Systematically test three user preference overrides in Web Inspector: dark mode, reduced motion, and increased contrast
- Why it matters: These preferences directly affect a large number of users, and testing does not require changing system settings
- How to start: Open the User Preference Overrides popover, switch each preference one by one, and verify layout and interactions adapt correctly. Prepare alternative animations for
prefers-reduced-motion
3. Eliminate unexpected scrolling with Scroll badges
- What to do: Scan for Scroll badges in the Elements panel and fix all unexpected horizontal or vertical scrolling
- Why it matters: When scrollbars are hidden, unexpected scrolling is hard to notice and can truncate content or confuse users
- How to start: Inspect elements with Scroll badges, review their
overflowproperties and child dimensions. Common fixes include adjustingmin-width,flexproperties, orwhite-space
4. Debug third-party code with Symbolic Breakpoints
- What to do: When debugging issues involving browser built-in APIs or third-party libraries, use Symbolic Breakpoints to locate the call chain
- Why it matters: You do not need to find locations in minified third-party code—break directly on function names
- How to start: Add a Symbolic Breakpoint in the Sources tab, enter the target function name (such as
fetchorlocalStorage.setItem), trigger it, then inspect the Call Stack to find the call site in your code
5. Clean up stale event bindings with Event badges
- What to do: Periodically check Event badges in the Elements panel and confirm every event listener is still needed
- Why it matters: Duplicate or stale bindings can cause memory leaks and unexpected behavior
- How to start: Walk through key interactive elements, click Event badges to review listener lists, and verify event type, handler, and options. Remove unnecessary listeners in source code
Related Sessions
- Rediscover Safari developer features — Comprehensive update to Safari developer features, including device pairing and responsive design mode
- What’s new in CSS — New CSS features, including container queries and cascade layers
- What’s new in WebKit — New features and improvements in the WebKit engine
- Meet Safari Web Extensions — Developing Safari Web Extensions
- Explore WKWebView additions — New WKWebView APIs and capabilities
Comments
GitHub Issues · utterances