
Highlight
Xcode 14 allows cross-target build tasks to be executed in parallel earlier through the new Swift Driver integration, emit-module separation and Eager Linking. At the same time, the Build Timeline tool allows developers to intuitively see parallel bottlenecks in the build for the first time.
Core Content
The root cause of slow construction: the critical path is too long
After pressing Cmd+B, the Xcode build system analyzes the entire project’s dependency graph. Compilation produces .o files, and the linker consumes .o files to generate executable files. There are clear input and output dependencies between these tasks.
As projects get larger, the dependency graph becomes more complex. The build system will prioritize tasks without dependencies and unlock downstream tasks after completion. But there are always some tasks that are strung together to form a “critical path” - no matter how many CPU cores there are, the tasks on this path must be executed one by one.
There is only one way to shorten the critical path: break the dependencies on the path and allow more tasks to be parallelized.
Two levels of parallelization in Xcode 14
Apple addresses build parallelism at two levels:
- Target internal: Compilation, resource copying, code signing, etc. build phases are scheduled according to input and output dependencies, and irrelevant phases are executed in parallel
- Between Targets: Through emit-module separation and Eager Linking, the downstream target no longer needs to wait for the upstream to be fully compiled and linked before it can start.
Detailed Content
Build Timeline: See the truth about build parallelism for the first time
(06:29)
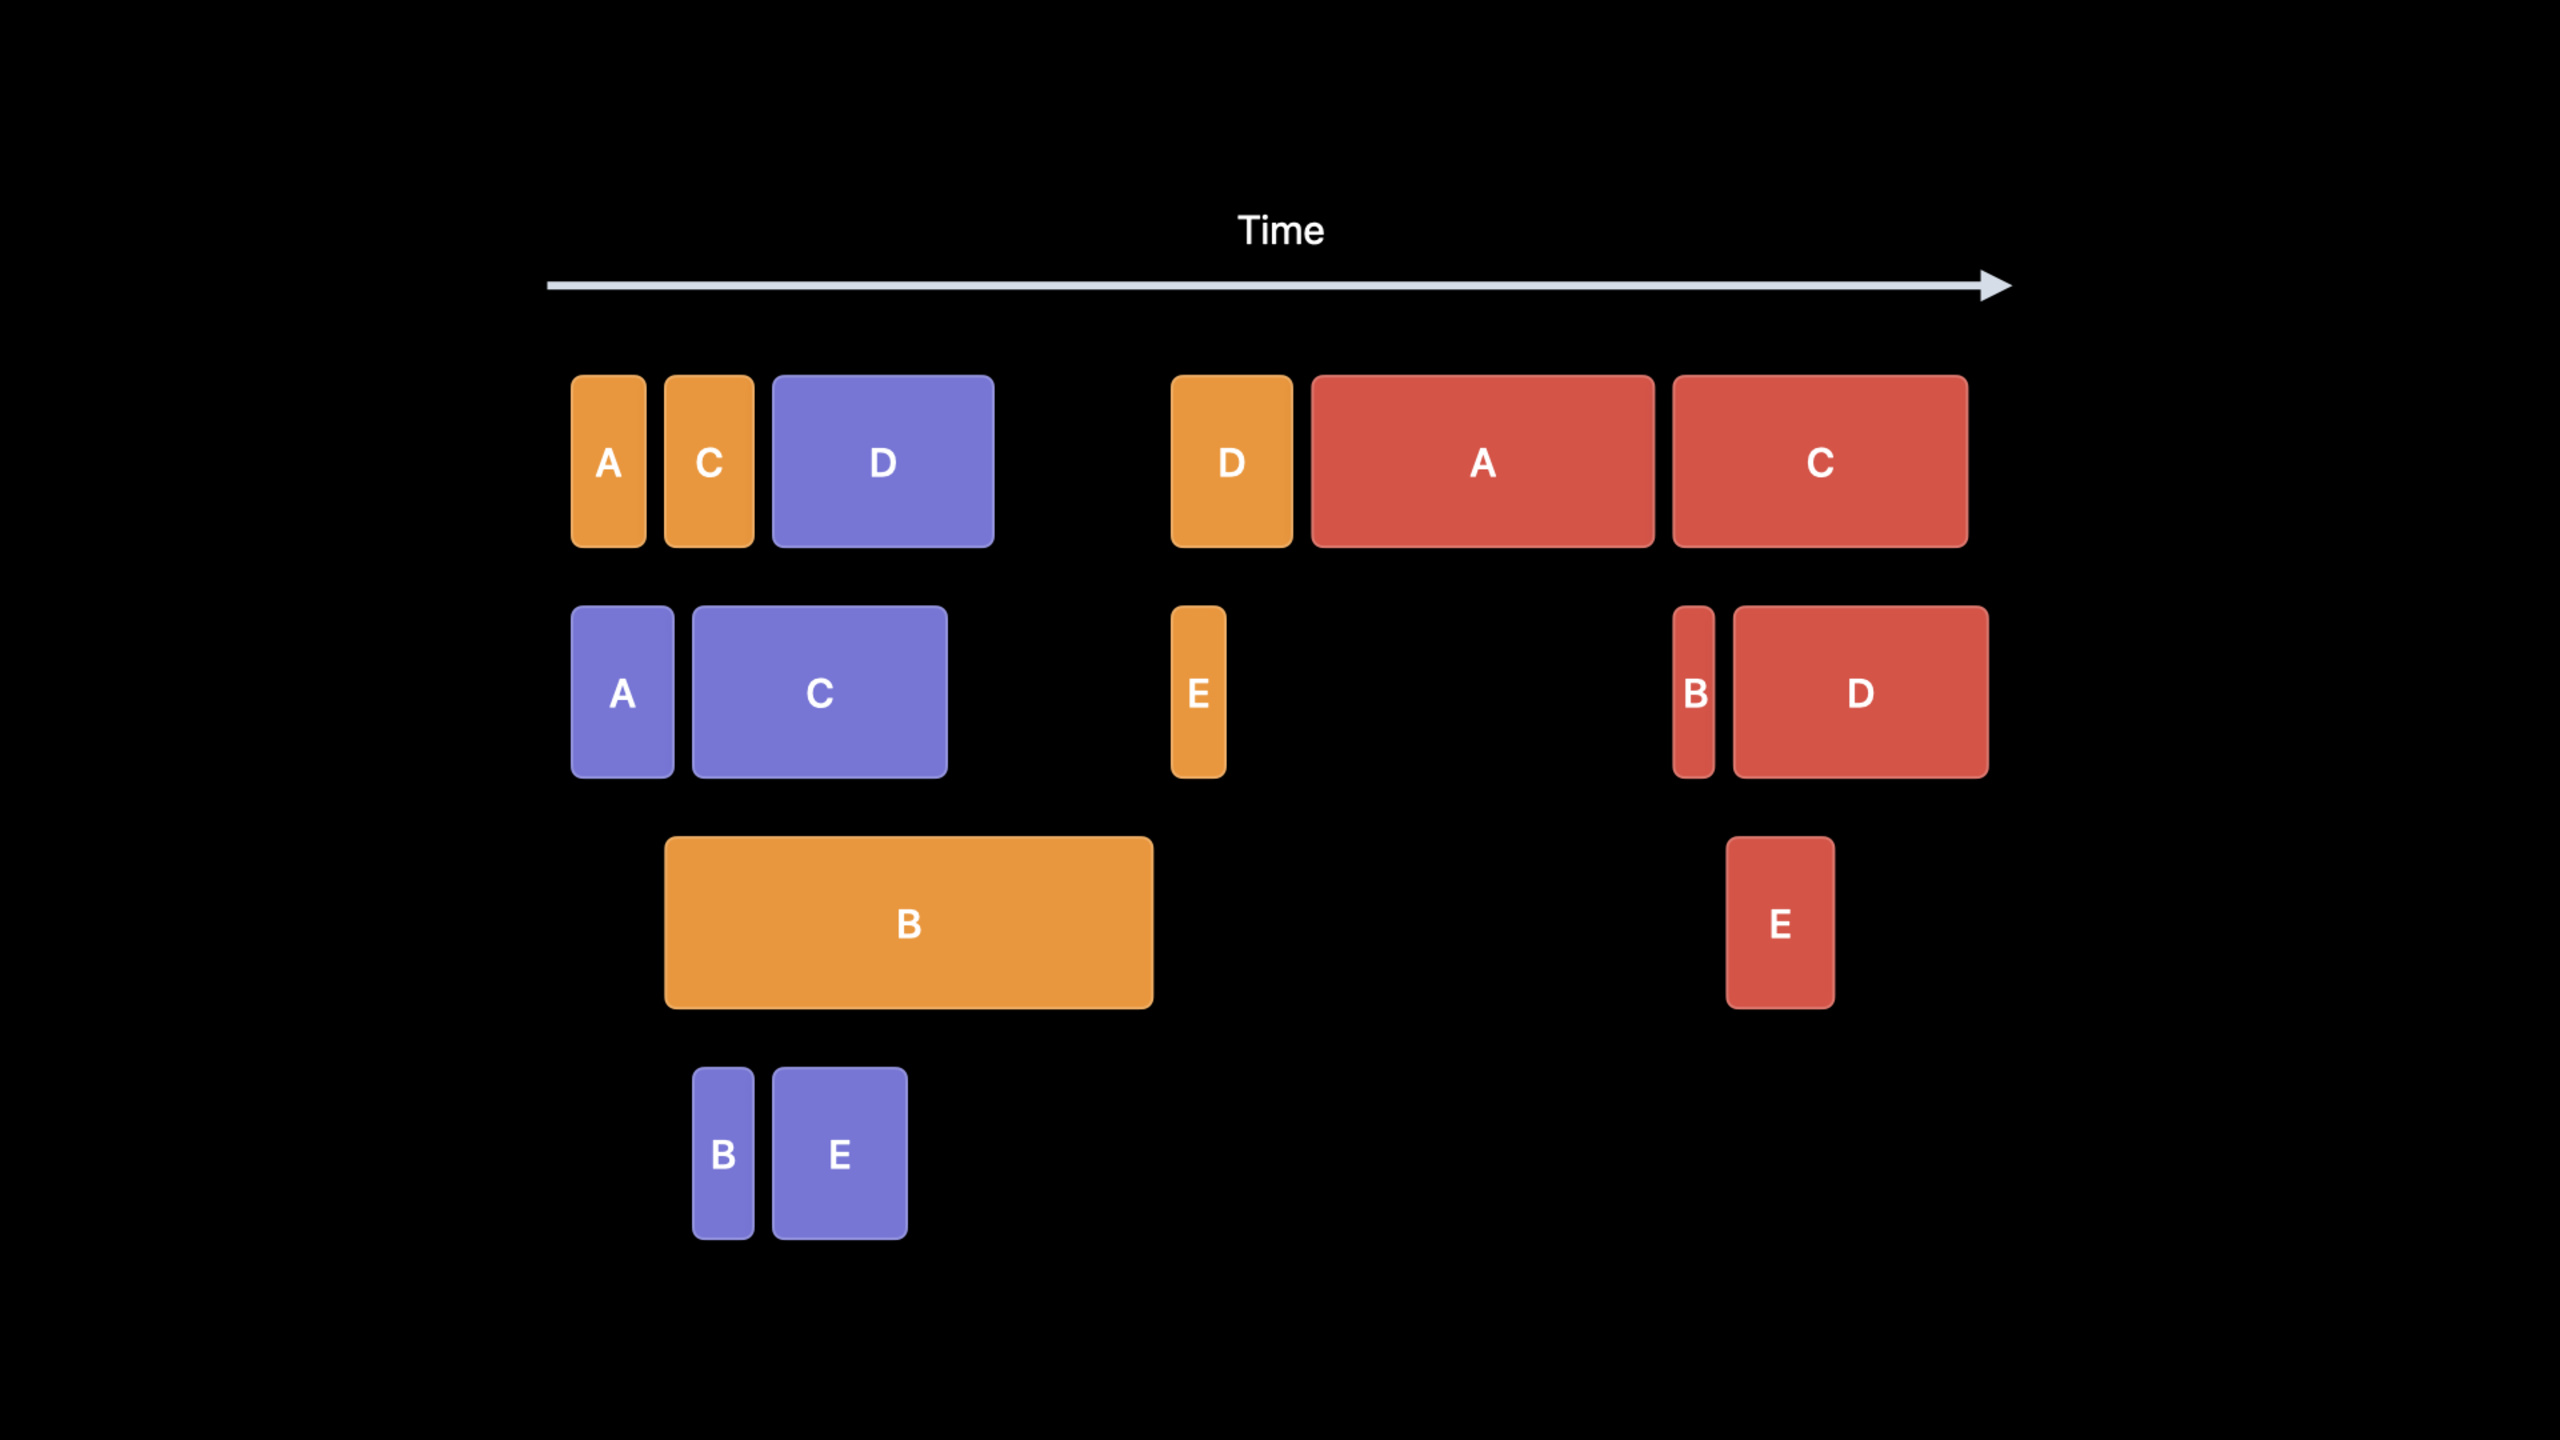
New in Xcode 14, Build Timeline is a core tool for understanding build performance. It differs from traditional build logs - organized by parallelism rather than hierarchy.
How to read Timeline:
- Horizontal axis = time, the longer the task, the wider it takes up
- Vertical axis = degree of parallelism, the number of rows at the same time represents the number of tasks executed simultaneously
- color = different target
- Blank = task is waiting for input, this is the optimization goal
How to open: After the build is completed, select Assistant in the Editor Options of the build log, and the Build Timeline will appear at the bottom. When a task is selected, the build log will automatically locate the corresponding entry; and vice versa.
Hold down Option to select an area, and the view will automatically zoom to that time period. This is useful when analyzing local bottlenecks.
Parallelization within Target: Dependency declaration of Script Phase
(10:35)
Build phase describes the build steps of a target. Compilation, resource copying, linking, and script execution are all build phases.
Compiling and copying resources can be done in parallel because they do not depend on each other. But linking must wait until compilation is complete, because the linker requires .o files.
Run Script Phase is special. Scripts do not have automatic input and output inference and must be declared manually. If the declaration is incomplete, the build system executes the script serially to avoid data races.
Xcode 14 introduced User Script Sandboxing, which forces scripts to only access declared input and output:
// Set in Build Settings
ENABLE_USER_SCRIPT_SANDBOXING = YES
If the script attempts to access an undeclared file, the build will simply fail with the offending path listed. This helps you discover missing dependency declarations.
When the script correctly declares input and output, it can be openedFUSE_BUILD_SCRIPT_PHASES = YESLet multiple scripts execute in parallel.
Key points:
- Sandbox is not a security feature and only covers the project source code directory and Derived Data
- Missing input and output declarations can cause incorrect incremental builds
- If two scripts have file dependencies, they must be declared correctly, otherwise parallel execution will cause data competition.
Swift Driver rewritten: deep integration of build system and compiler
(19:50)
Before Xcode 14, the Xcode Build System and Swift Driver scheduled tasks independently. The Driver is responsible for splitting Swift compilation into subtasks, but the Build System cannot see these subtasks and cannot optimize them globally.
The Swift Driver in Xcode 14 has been completely rewritten in Swift and is deeply integrated with the Build System. All subtasks enter a unified task pool and are uniformly scheduled by the Build System.
This brings two direct benefits:
- The scheduler can allocate tasks based on the actual number of CPU cores to avoid over-subscription.
- Significant reduction in idle time on high core count machines
Emit-Module separation: downstream targets start compilation earlier
(21:36)
When a Swift target compiles, other targets need its module files to start compilation. Previously, modules could not be generated until all compilation tasks were completed.
Xcode 14 and Swift 5.7 split module generation into independent emit-module tasks, which generate modules directly from all source files without relying on compiled .o files:
// Compilation flow changes
// Before: Compile all -> Link -> Emit module -> downstream targets start compiling
// Now:    Emit module (parallel) -> downstream targets start compiling once they receive the module
//         Compile all (parallel) -> Link
The downstream target can start compilation as soon as emit-module is completed, without waiting for the upstream link to be completed. This significantly reduces waiting time on the critical path.
Eager Linking: Links can also be advanced
(22:28)
Under normal circumstances, when target B links to target A, it must wait for the link of target A to complete. Eager Linking breaks this dependency.
The emit-module task will also generate a text format dynamic library stub (TBD file), which lists the symbols that the target target will eventually export. The linking task of target B can rely on this stub instead of waiting for the complete linking product of target A.
How to enable:
// Build Settings
EAGER_LINKING = YES
Key points:
- only applies to dynamic linking between pure Swift targets
- Depend on target’s emit-module product, not linked product
- The stub contains a list of symbols, the linker uses this information to start working ahead of time
Core Takeaways
-
Open Build Timeline to analyze your project Find large empty areas in the Timeline. These are blocked tasks. See which targets take a long time to compile and check whether there are unnecessary dependency chains.
-
Declare complete input and output for all Run Script Phases turn on
ENABLE_USER_SCRIPT_SANDBOXING = YES, and let the build system find missing dependencies for you. Open after repairFUSE_BUILD_SCRIPT_PHASES = YESLet the scripts execute in parallel. -
Split the large Framework into smaller Swift Packages The benefits of emit-module separation and eager linking are more obvious in modular projects. The emit-module of small modules is completed faster, and the downstream target can start compilation earlier.
-
Monitor build time trends in CI Build Timeline can be used with CI. Record the time of each full build, and promptly analyze the timeline to find new bottlenecks when abnormal growth is found.
-
Reevaluate build performance after upgrading to Xcode 14 The scheduling optimization brought about by Swift Driver rewriting is effective for all projects and does not require code changes. Compare Xcode 13 and 14 build times on the same machine to quantify the benefits.
Related Sessions
- Link fast: Improve build and launch times — Xcode 14 linker optimization, link time improved by up to 2 times
- What’s new in Xcode 14 — Overview of all new features in Xcode 14
- Deep dive into Xcode Cloud for teams — Build optimization in CI/CD for teams
- Improve app size and runtime performance — Runtime optimization at the compiler level, complementary to build optimization
- Create Swift Package plugins — Customize the build process with Swift Package plugins
Comments
GitHub Issues · utterances