
Highlight
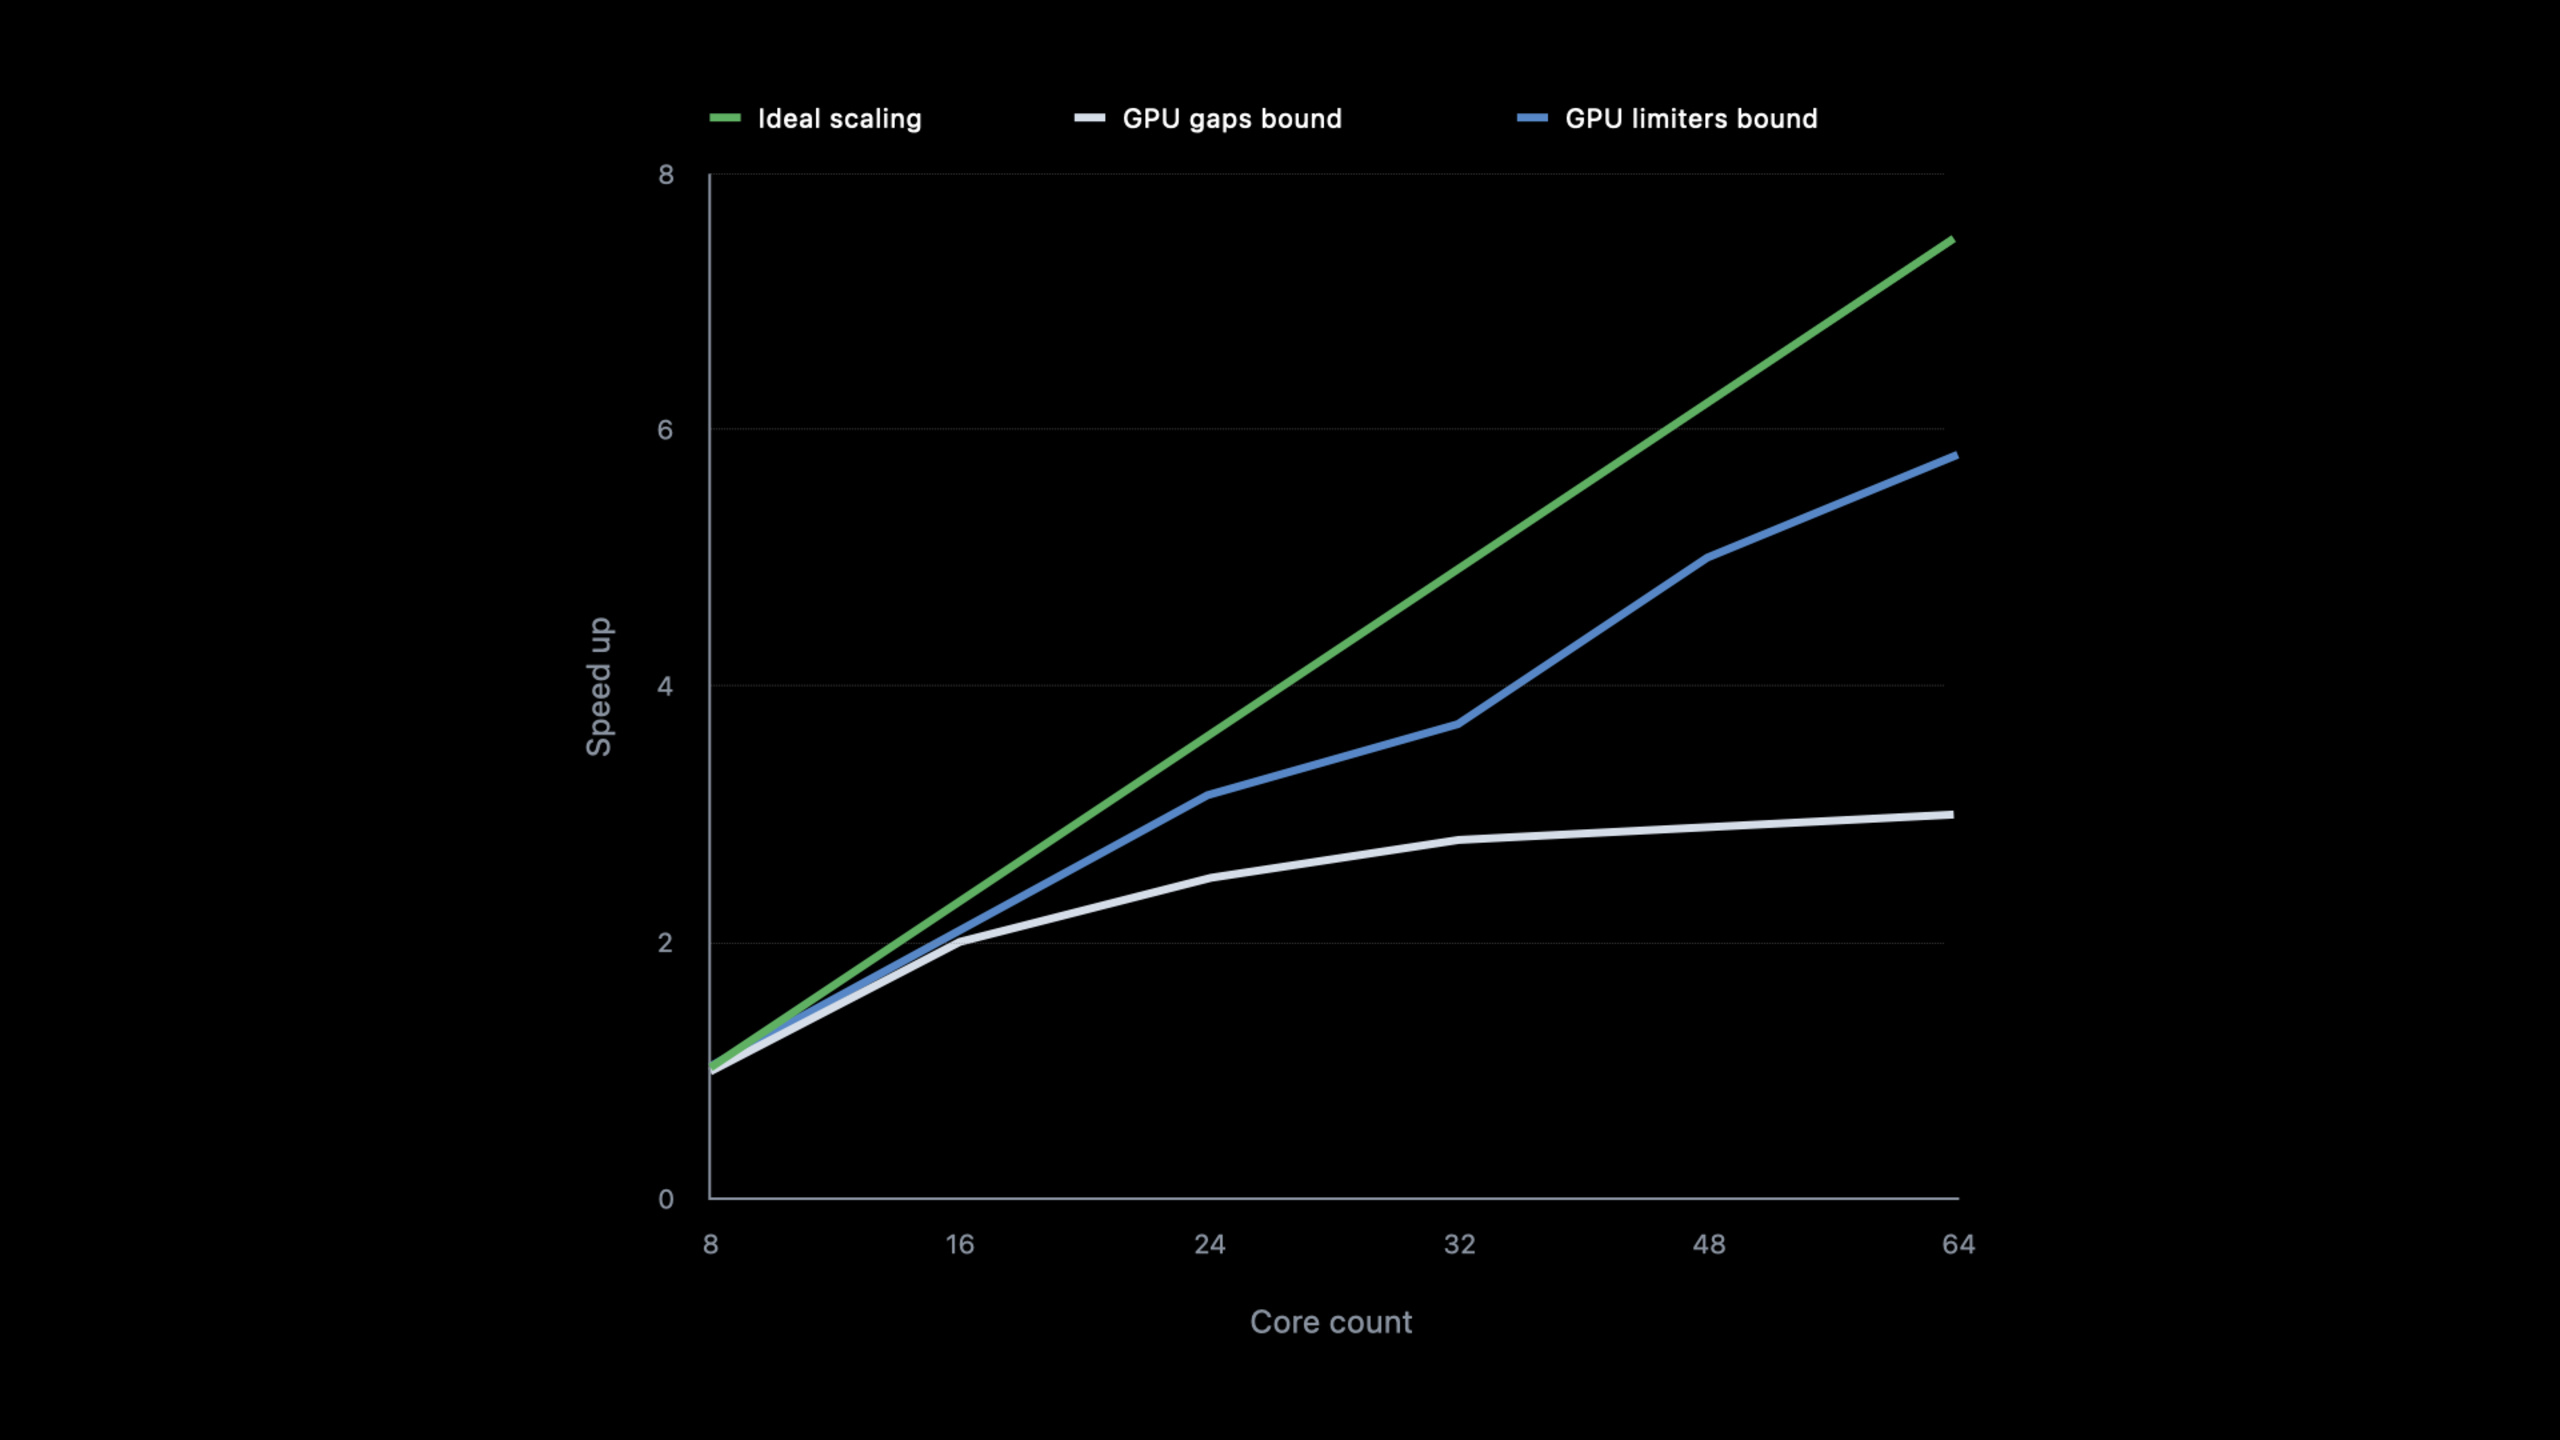
Apple M1 GPU shares the same architecture from 8-core iPad to 64-core Mac Studio, but to obtain linear scaling performance for computing workloads, three major bottlenecks need to be solved: uneven work distribution, idle GPU timelines, and atomic operation competition.
Core Content
Your Metal computing application runs well on M1, but the performance is only improved by 30% on M1 Ultra, which is far from the effect of doubling the number of cores. What’s the problem?
The scalability of a GPU workload refers to whether the performance can increase proportionally as the number of GPU cores increases. The ideal situation is linear scaling - double the number of cores and double the performance. Three non-ideal situations are common in reality: performance reaches a plateau, there are a large number of idle gaps in the GPU timeline, and performance improvement is uneven (bottlenecks are encountered in certain core number ranges).
(00:59) The Apple M1 GPU family has expanded from 8 to 64 cores, with the same GPU architecture supporting all Metal 3 features. Professional apps like Affinity Photo and DaVinci Resolve already offer excellent cross-device scalability.
Bottlenecks are divided into two categories: computation-bound and bandwidth-bound. You may switch back and forth between the two during the optimization process. If computation is the bottleneck, try offloading part of the load to memory access; and vice versa. The MPS and MPSGraph frameworks are optimized for all hardware, but custom compute kernels still require manual tuning.
(04:37) Work distribution is the first link that needs to be checked. Workloads are distributed in a 3D threadgroup grid. Thread groups are evenly distributed across GPU cores, and each thread group has access to thread group memory with limited capacity but extremely fast speed. A single thread group is further split into SIMD-groups (width is fixed to 32 on Apple GPUs). Maximum of 1024 threads per thread group, maximum 32KB of thread group memory.
If the number of thread groups is too small, the GPU cannot be saturated. The rule of thumb is: each shader core requires 1K to 2K concurrent threads to achieve good occupancy. M1 (8 cores) requires at least 8K-16K threads, M1 Max (32 cores) requires 32K-64K, and M1 Ultra (64 cores) requires 64K-128K.
(06:43) Another common problem is that the thread group is too large. Thread groups that are too large prevent even distribution of load across GPU cores. Best practice is to use the smallest multiple of SIMD width (32) that maps well to your workload.
Detailed Content
Eliminate GPU timeline gaps
(08:18) GPU idle is the biggest performance killer. Consider a workload that only utilizes 50% of the GPU due to CPU/GPU serialization. The CPU does part of the work, waits for the GPU to finish, and then does the next part. Even if the GPU cores are doubled, the overall performance improvement is limited: after doubling the cores, the GPU part is twice as fast, but the CPU part remains unchanged, and the total time is reduced from 2 units to 1.5 units, which is only an improvement of 33%.
The root cause is usuallywaitUntilCompletedResulting CPU/GPU synchronization. There are several ways to fix it:
Use MTLSharedEvents instead of waitUntilCompleted
// Not recommended: block the CPU while waiting for the GPU
[commandBuffer waitUntilCompleted];

// Recommended: use shared events to reduce synchronization overhead
id<MTLSharedEvent> sharedEvent = [device newSharedEvent];
[commandBuffer encodeSignalEvent:sharedEvent value:1];
// The CPU can check the event state when needed without blocking
Key points:
waitUntilCompletedWill block the current thread, causing gaps in the GPU timeline -MTLSharedEventsLower overhead, allowing more flexible synchronization strategies- Completely remove CPU/GPU sync points if possible
Pipelined Workloads
(10:57) If the algorithm knows the next batch of data in advance, it can encode the next batch of work before waiting for the shared event. This way the GPU never runs dry and there’s always work to do.
Use concurrent dispatches
(12:54) For scenarios where multiple pictures are processed, they were originally processed one by one serially. useMTLDispatchTypeConcurrentFinally, the driver can interleave the execution of independent work for different pictures, hiding the kernel synchronization overhead, and filling the startup and finishing phases of each kernel at the same time.
// Create a command buffer that supports concurrent dispatch
id<MTLCommandBuffer> commandBuffer = [commandQueue commandBufferWithUnretainedReferences];

// Use concurrent dispatch type
// Insert barriers manually to manage dependencies
The experimental results show that the interleaved processing of two pictures is improved by 30%, and the parallel processing of three pictures is improved by 70%.
Optimize atomic operations
(14:07) Global atomic operations (global atomic operations) are consistent across the entire GPU. When a large number of threads compete for the same memory address, performance will drop sharply, and the more cores there are, the more serious the competition will be.
Take the reduction algorithm as an example: sum the values in all buffers.
Not recommended: Each thread directly performs an atomic add to the main memory.
// Poor performance: all threads compete for the same global address
kernel void badReduction(device float* buffer [[buffer(0)]],
                         device atomic_float* result [[buffer(1)]],
                         uint gid [[thread_position_in_grid]])
{
    atomic_fetch_add_explicit(result, buffer[gid], memory_order_relaxed);
}
Recommended approach: Two-level reduction, first using SIMD instructions and threadgroup atomic operations within the thread group, and finally writing only one global atom for each thread group.
kernel void goodReduction(device float* buffer [[buffer(0)]],
                          device atomic_float* result [[buffer(1)]],
                          uint lid [[thread_index_in_threadgroup]],
                          uint tgid [[threadgroup_position_in_grid]])
{
    threadgroup float sharedSum;

    // Step 1: Reduce within the SIMD-group using register operations without memory access
    float localSum = buffer[lid]; // Simplified example
    localSum = simd_sum(localSum);

    // Step 2: The last thread in each SIMD-group writes to threadgroup memory
    if (lid == 31) {
        atomic_fetch_add_explicit(&sharedSum, localSum, memory_order_relaxed);
    }

    threadgroup_barrier(mem_flags::mem_threadgroup);

    // Step 3: Each threadgroup writes only one global atomic
    if (lid == 0) {
        atomic_fetch_add_explicit(result, sharedSum, memory_order_relaxed);
    }
}
Key points:
simd_sumWait for SIMD-group instructions to exchange data between registers without memory round-trips- Threadgroup atomic operations are processed by independent threadgroup memory for each GPU core, scaling linearly with the number of cores
- The number of global atomic operations in the last step is equal to the number of thread groups, and the completion time of each thread group is different, which naturally disperses competition.
Optimize memory access mode
(17:15) Even if the GPU timeline has no gaps, scaling performance may still be suboptimal. This is when you need to check GPU limiters. Xcode and Metal System Trace provide detailed counters.
Inefficient memory access can lead to high Last Level Cache (LLC) or MMU limiter, and low utilization. Two optimization directions:
- Reorganize data layout: Make data access more localized
- Adjust access mode: Let the access mode of the thread group match the data layout
(18:12) Assume that the data in memory is arranged in rows, but the thread group accesses it in a square 2D pattern. The data accessed by the first SIMD-group is packed into the cache line, but most of the cache line space is wasted. One solution is to reorganize the data into strips so that thread groups can fully utilize each cache line.
Another option is to reshape the thread group. For example, replacing square thread groups with more elongated rectangular thread groups aligns access patterns with row-major data layout.
Blender Cycles Case
(20:08) Blender Cycles uses sorting to reduce thread divergence: sorting ray hits by material type. This reduces thread divergence but increases spatial memory divergence, resulting in a high MMU limiter.
Solution: Partition the memory range before sorting. Ensure that indexes on the same partition are not mixed when sorting. In this way, the data range accessed by SIMD-group is limited to the partition, which greatly reduces MMU pressure. Experimental results: Top limiter and LLC limiter are reduced by about 20%, GPU read bandwidth is significantly improved, and overall performance is improved by 10% to 30% (depending on the scenario).
Core Takeaways
Optimize your image processing pipeline
If you have an app for batch image filtering, check to see if you are using itwaitUntilCompletedSerialize CPU and GPU. Use insteadMTLSharedEventsCoupled with pipelining, the GPU utilization can be increased from 50% to nearly 100%, achieving near-linear performance expansion on the M1 Ultra. The entrance isMTLSharedEventandencodeSignalEvent:value:。
Implementing parallel particle systems on GPU
Particle simulation usually requires position updating, collision detection, and rendering every frame. Use concurrent dispatch to stagger and submit the work of different particle groups to hide kernel synchronization overhead. Note that barriers are manually inserted at dependency points. The key APIs areMTLDispatchTypeConcurrent。
Optimized memory layout for machine learning inference
If your app uses Metal for custom neural network layers, check the memory access patterns. Rearranging the weight data from row-major to a format more suitable for thread group access can significantly reduce the LLC limiter. Use Xcode 14’s new counters (MMU Limiter, MMU Utilization, MMU TLB Miss Rate) to verify the optimization effect.
Related Sessions
- Discover Metal 3 — Overview of new features in Metal 3
- Program Metal in C++ with metal-cpp — Write Metal code in C++
- Transform your geometry with Metal mesh shaders — Metal Mesh Shaders geometry processing pipeline
Comments
GitHub Issues · utterances