
Highlight
Jack Xu and Seth Lu from the Apple GPU software team systematically explained the analysis and optimization methods of game memory. The content starts from the basic concepts of memory and gradually goes into the memory analysis tools of Instruments, memory graph analysis of Xcode, and resource optimization of Metal Debugger.
Core Content
Memory problems in games often start with a number: the current memory usage in the Xcode Memory Report becomes high, the device begins to strain, and finally the game may be throttled by the system. The first reaction of developers is usually to look at the allocation amount, but this session first corrected this entry: the allocation occurs in the virtual address space, and what is really counted into the limit by the system is the memory footprint (memory footprint).
This difference will change the order of investigation. Games can allocate large virtual areas, but only the pages being accessed will go into physical memory. The memory page granularity of modern Apple devices is 16 KiB. The system charges the game for dirty, compressed, and swapped pages. Although clean pages may reside in memory, they can be reloaded from disk and are not included in the footprint.
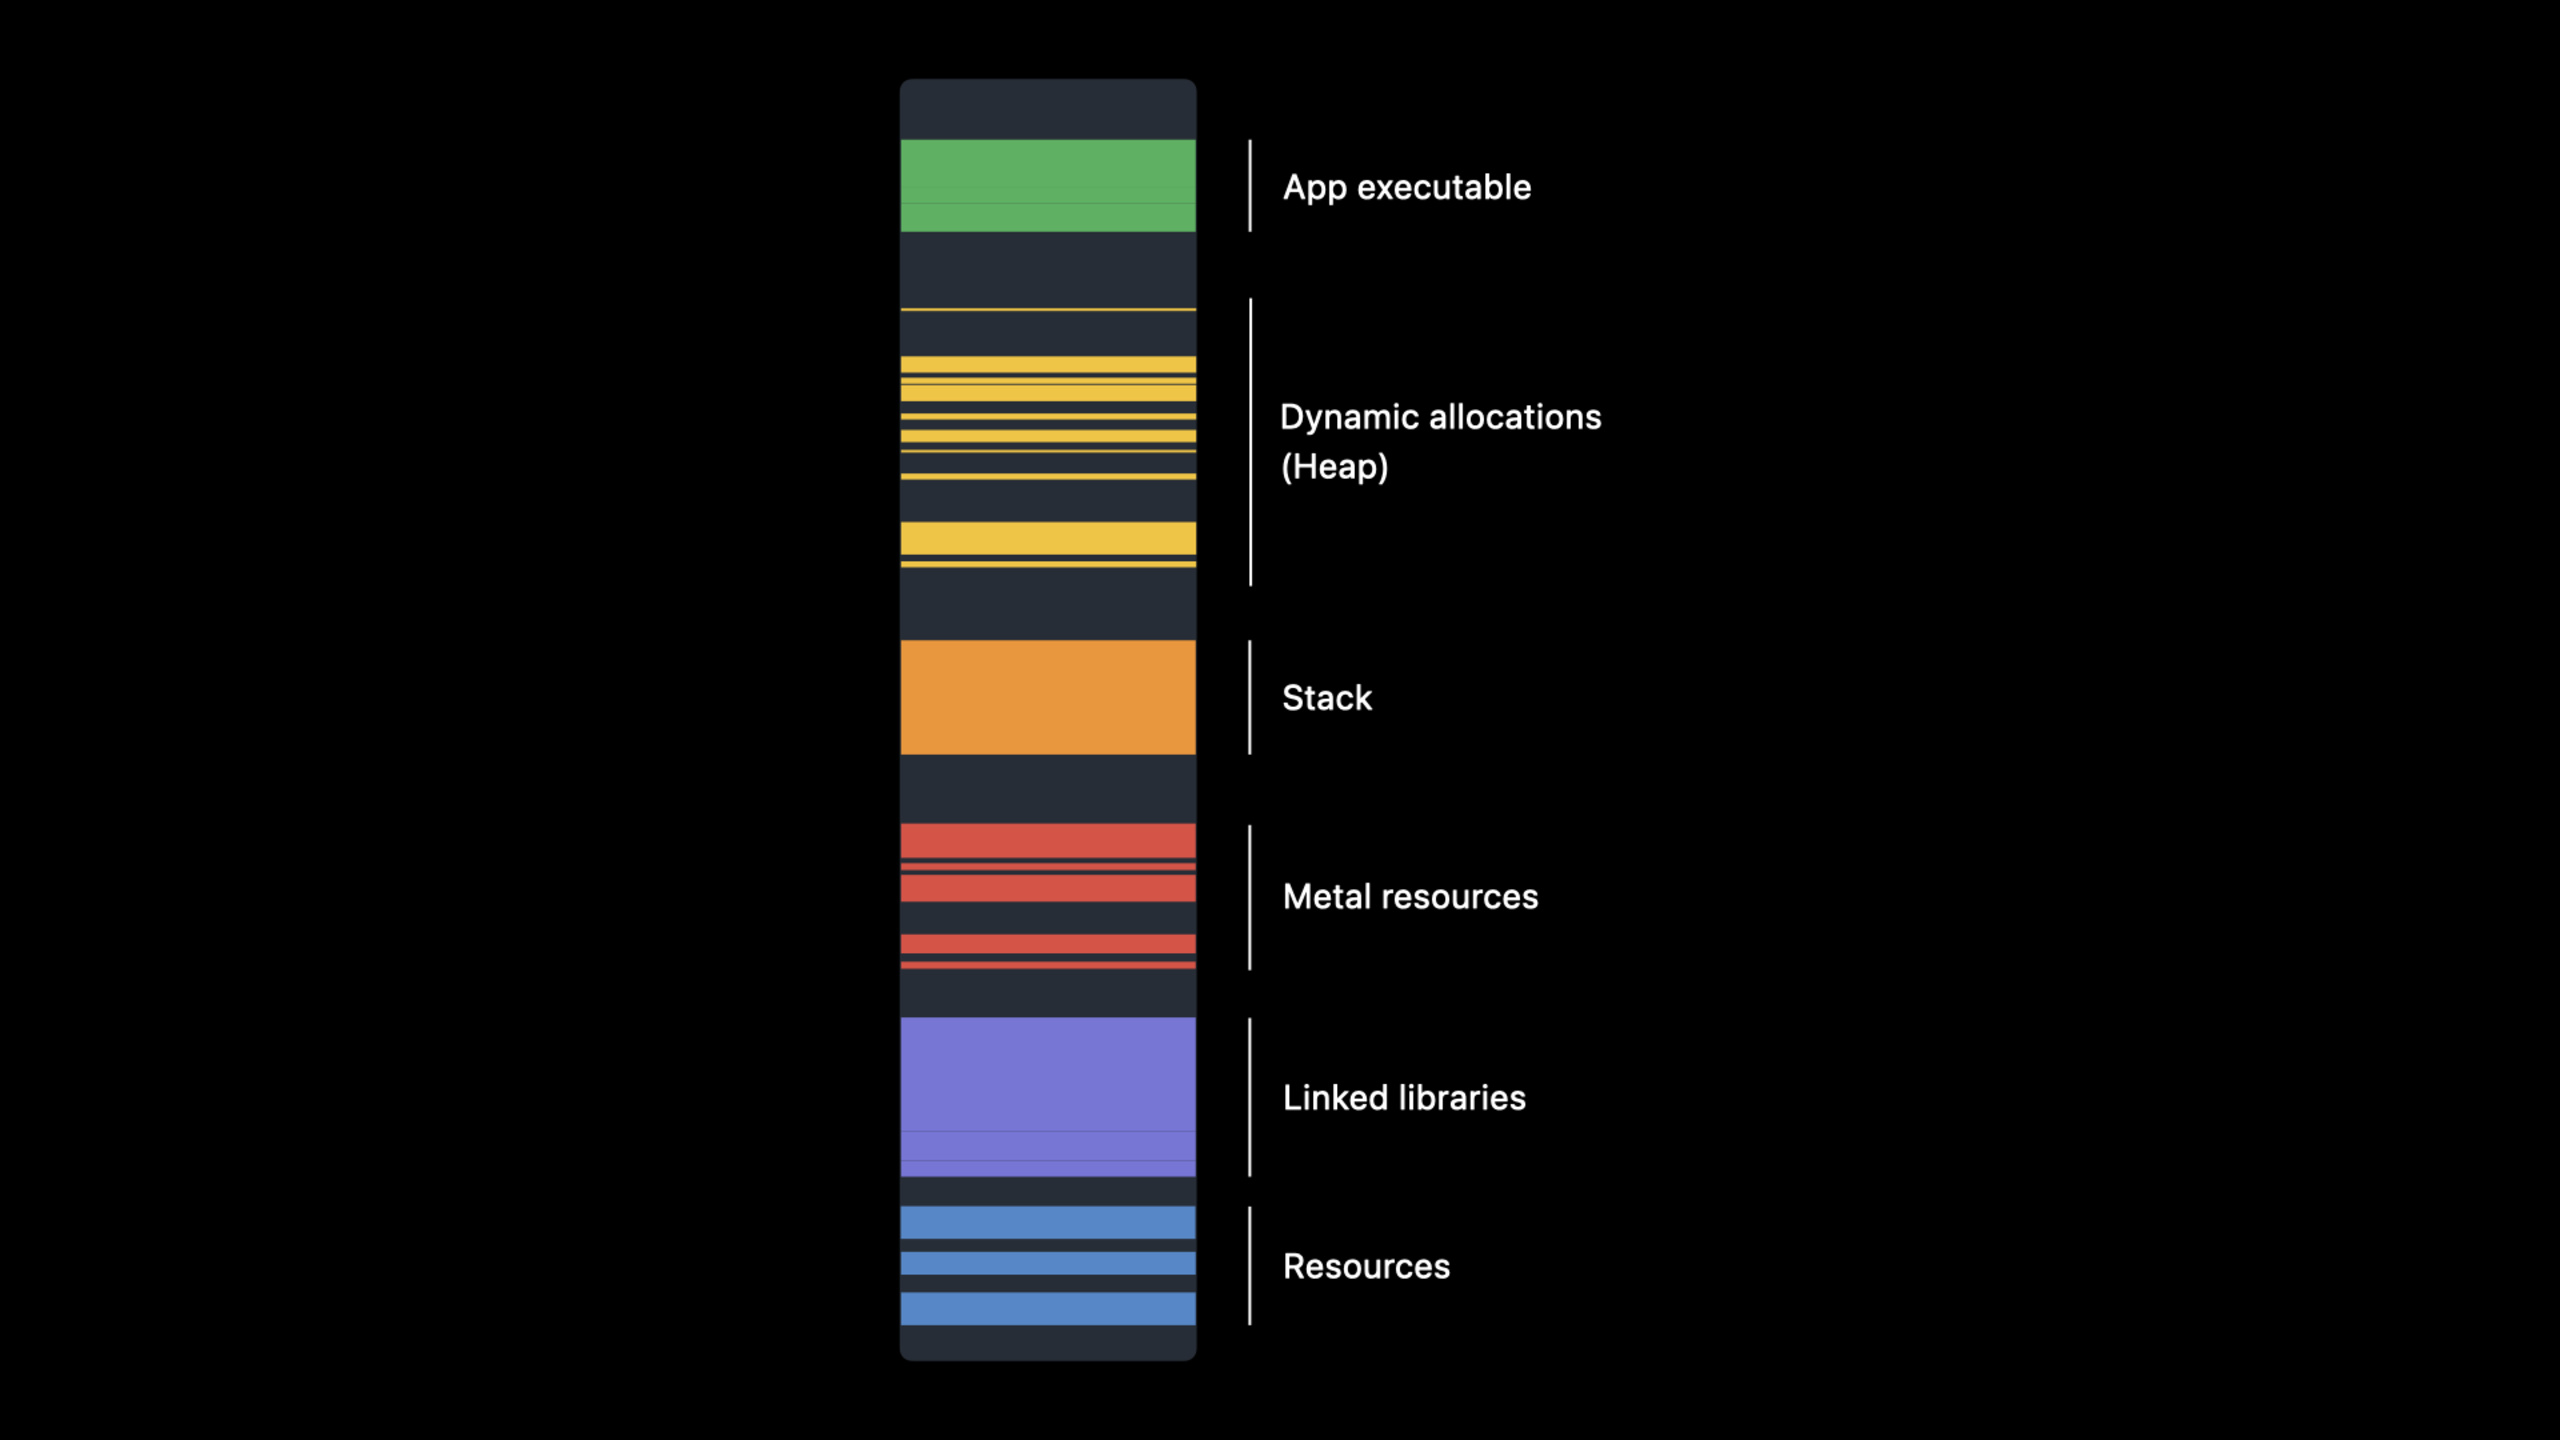
Metal games have an extra layer of complexity. Apple silicon uses unified memory, and the CPU and GPU share the same pool of fast memory, so the accessed Metal buffer, texture, and pipeline state objects will also enter dirty memory. Textures, buffers, drawables, heap allocations and anonymous VMs need to be looked at in the same analysis process.
The workflow given by Apple is divided into three steps. The first step is to use the Xcode Memory Gauge and system API to confirm the footprint and available memory. In the second step, use Instruments’ Game Memory template to record memory growth. The third step is to capture the memory graph at a certain point in time, using Xcode Memory Debugger,footprint、vmmap、heap、malloc_history、leaksFind large objects, allocation sources, and reference relationships. Finally, enter Metal Debugger’s Memory Viewer to audit resource size, recent usage time, pixel format, storage mode and heap aliasing.
Detailed Content
1. Look at footprint first, don’t just look at allocations
(06:53) Jack made a clear distinction between allocations and actual memory use in the first half. allocations are areas of the virtual address space requested by the game. Memory footprint is the amount of physical memory actually billed to the game by the system, and is also a metric used by some Apple platforms when enforcing memory limits.
The game can query how much memory is left in the current environment at runtime. Available on iOS, iPadOS, tvOS and watchOSos_proc_available_memory()。
#import <os/proc.h>

API_UNAVAILABLE(macos) API_AVAILABLE(ios(13.0), tvos(13.0), watchos(6.0))
size_t os_proc_available_memory(void);
Key points:
#import <os/proc.h>Introduce process-related system interfaces. -API_UNAVAILABLE(macos)Indicates that this query interface is not available for macOS. -API_AVAILABLE(...)Indicate available platforms and minimum system versions. -os_proc_available_memory()Returns the system memory size available for the current process, which can be used to dynamically adjust resource loading strategies.
(07:07) If you want to see the current footprint and life cycle peak, you can useproc_pid_rusage()readrusage_info_current。
#if __has_include(<libproc.h>)
#include <libproc.h> // On macOS.
#else
#include <sys/resource.h> // On iOS, iPadOS and tvOS.
int proc_pid_rusage(int pid, int flavor, rusage_info_t *buffer)
    __OSX_AVAILABLE_STARTING(__MAC_10_9, __IPHONE_7_0);
#endif

rusage_info_current rusage_payload;

int ret = proc_pid_rusage(getpid(),
                          RUSAGE_INFO_CURRENT, // I.e., new RUSAGE_INFO_V6 this year.
                          (rusage_info_t *)&rusage_payload);
NSCAssert(ret == 0, @"Could not get rusage: %i.", errno); // Look up in `man errno`.

uint64_t footprint       = rusage_payload.ri_phys_footprint;
uint64_t footprint_peak  = rusage_payload.ri_lifetime_max_phys_footprint;
Key points:
__has_include(<libproc.h>)Choose the header file according to the platform, macOS useslibproc.h。proc_pid_rusage(getpid(), RUSAGE_INFO_CURRENT, ...)Query the resource usage of the current process. -rusage_info_currentThe return data is carried here, and the session indicates that it corresponds to the current yearRUSAGE_INFO_V6。ri_phys_footprintis the current physical footprint. -ri_lifetime_max_phys_footprintis the peak footprint during the process life cycle.
These two interfaces are suitable for putting into the resource management layer of the game. For example, check the available memory before entering a high-quality map; when it is detected that the footprint is close to the budget, reduce the preload texture, lower the cache limit, or delay the loading of resources that are not within the field of view.
2. Use Game Memory template to record the growth process
(09:10) Seth introduced the new Instruments Game Memory template in Xcode 14. This template includes instruments such as Allocations, Metal Resource Events, VM Tracker, Virtual Memory Trace, Metal Application, and GPU. It puts CPU allocation, Metal resource events, and VM footprint on the same timeline.
Games often allocate resources intensively during the startup phase. It is recommended to start profiling from a new game launch rather than attaching to an already running process. Only in this way can we see the growth curve during the startup period.
(10:04) In addition to clicking Profile from Xcode, you can also usexctraceAutomatic recording.
xctrace record --template "Game Memory" \
               --attach ModernRenderer \
               --output ModernRenderer.trace \
               --time-limit 30s
Key points:
xctrace recordStart an Instruments recording. ---template "Game Memory"Specify the new template for this session’s explanation. ---attach ModernRendererAttach to a process named ModernRenderer. ---output ModernRenderer.traceSave the results as a trace file. ---time-limit 30sControlling the recording duration is suitable for reproducing the startup period or a fixed period of gameplay in an automated process.
(10:14) If you want to specify the device, you can add--device-name。
xctrace record --device-name "Seth's iPhone" \
               --template "Game Memory" \
               --attach ModernRenderer \
               --output ModernRenderer.trace \
               --time-limit 30s
Key points:
--device-nameSelect iPhone, iPad, or Apple TV as the target device.- The remaining parameters remain the same, making it easier to use the same set of profiling commands for different devices.
- The generated trace can be opened repeatedly to compare the memory growth of different resource packages, different levels or different image quality settings.
(10:23) Watch Allocations first after recording. It shows heap allocations, anonymous VMs, allocation sizes, object reference counts, and allocation stacks. In Metal games, IOAcelerator usually corresponds to Metal resources, and IOSurface corresponds to drawables. Allocations displays the allocation size by default. You can also switch to Allocation Density to see when allocation peaks occur.
(12:50) Then look at Metal Resource Events. Here you can see the allocation and release history of Metal resources. Session specifically mentioned that resources can be labeled through the Metal API, so that specific textures or buffers can be identified by name in the tool.
(13:38) Finally, look at VM Tracker. Dirty Size is uncompressed dirty memory, and Swapped Size is compressed or swapped memory. It answers the question: How many of these allocations go into the footprint.
3. Capture the memory graph and disassemble the current state
(15:09) Instruments are suitable for viewing timelines. Memory graph is suitable for viewing the complete status at a certain moment. It saves object creation history, reference relationships, compression and swapout information. You can catch it once when the problem occurs, or you can catch it once before and after the problem occurs for comparison.
Before analyzing the memory graph, the session recommends turning on Malloc Stack Logging. It records allocation information so that subsequent tools can trace the source of the object.
(16:52) When not starting from Xcode, you can use environment variables to enable it.
# See `man malloc`.
MallocStackLogging=lite # Live allocations only.
MallocStackLogging=1    # All allocation and free history.
Key points:
MallocStackLogging=liteOnly allocations that are still alive are recorded, which is less expensive. -MallocStackLogging=1Record all allocation and release history, suitable for checking fragmentation and other issues.- During the session, Jack said that most people only look at scenes referenced by live objects, and Live Allocation Only is recommended.
- After turning on,
heap、malloc_historyTools such as
(18:07) Mac games are availableleaksCapture the memory graph at the command line.
leaks $PID     --outputGraph foo.memgraph
# or
leaks GameName --outputGraph foo.memgraph
Key points:
leaks $PIDCapture by process ID. -leaks GameNameCapture by process name. ---outputGraph foo.memgraphSave the snapshot as a memory graph file.- Session mentioned that this method can be executed remotely in SSH and is suitable for scenarios where full-screen games need to maintain focus.
(18:41) After getting the memory graph, first usefootprintSee high-level classification. It will list categories such as IOAccelerator, MALLOC_*, VM_ALLOCATE, etc. When the game uses Unity or a custom allocator, large chunks of anonymous memory may appear as untagged VM_ALLOCATE.
(20:12) Apple platforms allow applications to use up to 16 app-specific tags. Custom allocators can label anonymous mappings, making them easier to identify in tools later.
size_t length;

int tag = VM_MAKE_TAG(VM_MEMORY_APPLICATION_SPECIFIC_1); // Check out `man mmap`.

void * reservation = mmap(NULL,
                          length,
                          PROT_READ | PROT_WRITE,
                          MAP_ANONYMOUS | MAP_PRIVATE,
                          tag, // Instead of using default `-1`.
                          0);

if (reservation == MAP_FAILED) {
    @throw [[NSError alloc] initWithDomain:NSPOSIXErrorDomain
                                      code:errno
                                  userInfo:nil];
}

return reservation;
Key points:
VM_MAKE_TAG(VM_MEMORY_APPLICATION_SPECIFIC_1)Create a VM tag from 16 application custom tags. -mmap(...)Create an anonymous private mapping.- The fifth parameter is used
tag, replacing the default-1。 MAP_FAILEDBranch turns POSIX errors intoNSError, to facilitate upper-level processing.- The memory areas generated in this way will appear in clearer categories in subsequent analysis tools.
(20:30) If the code usesmach_vm_allocate, you can also bring similar tags in flags.
size_t page_count;

mach_vm_size_t allocation_size = page_count * PAGE_SIZE;
mach_vm_address_t vm_address;
kern_return_t kr;

kr = mach_vm_allocate(mach_task_self(),
                      &vm_address,
                      allocation_size,
                      VM_FLAGS_ANYWHERE | VM_MAKE_TAG(VM_MEMORY_APPLICATION_SPECIFIC_1));

if (kr != KERN_SUCCESS) { // Refer to mach/kern_return.h.
    @throw [[NSError alloc] initWithDomain:NSMachErrorDomain
                                      code:kr
                                  userInfo:nil];
}

return vm_address;
Key points:
allocation_size = page_count * PAGE_SIZECalculates allocation size in pages. -mach_task_self()Points to the current task. -VM_FLAGS_ANYWHERELet the system choose the appropriate address. -VM_MAKE_TAG(...)Incorporate app-specific tags into flags. -KERN_SUCCESSReturn values outside of will be converted into Mach error fields.
(21:12) Next usevmmapSee the split between dirty and swapped.footprintHere dirty size includes swapped and compressed,vmmapwill split them into different columns. Swapped columns often point to less used memory that may be optimized.
(23:32) then useheapLook at the malloc object. Xcode 14heapYou can use the information recorded by Malloc Stack Logging to identify the caller or responsible library to help locate which library or plug-in the large non-object memory comes from. In the session example, Manifold Garden’s memory graph shows that FMOD Studio and GameAssembly.dylib occupy considerable heap memory.
(26:45) After finding the large object address, usemalloc_historyCheck allocation call stack. You can also see the object’s allocation history in the inspector using the Xcode Memory Debugger.
(27:48) Finally, check the reference relationship.leaksYou can use the memory graph to check reference trees, leaks, and retain cycles. The redesigned memory graph view in Xcode 14 displays the ingoing and outgoing edges of the selected object and provides a neighbor selection popover, which is suitable for understanding why the object is still alive in complex game states.
4. Use Metal Debugger to audit GPU resources
(30:37) Metal resources often occupy large chunks of memory in games. Seth’s suggestion is to go into the Metal Debugger from a GPU frame capture and then open the Memory Viewer.
Memory Viewer’s table can filter resources by category, such as only viewing textures. Some of the most useful columns are:
- Insights: Lists memory optimization recommendations discovered by the tool.
- Allocated Size: Sort by resource size, audit the largest texture, buffer, and model data first.
- Time Since Last Bound: Find resources that have not been bound for a long time or even never used.
- Pixel Format: Check whether the texture can be changed to a more memory-saving format.
(33:03) If a resource has not been used for a long time, you can consider releasing it. If it may be used in the future, you can set it to volatile purgeable state. Metal can evict such resources when system memory pressure is high; once the resource becomes empty, the system no longer counts it in the game footprint. Before reusing, you need to check that the content is still there and reload it if necessary.
This logic can be expressed in pseudocode. The following is not an official snippet, it only describes the control flow.
for each metal_resource in captured_resources:
    if metal_resource.was_never_bound:
        audit_asset_loading_path(metal_resource)
    else if metal_resource.has_not_been_bound_for_a_while:
        mark_as_volatile_or_release(metal_resource)
    when_resource_is_needed_again:
        if resource_content_is_empty:
            reload_resource_content()
Key points:
was_never_boundCorresponding to resources that have never been used in Memory Viewer, check whether they are worth loading first. -has_not_been_bound_for_a_whileA great resource corresponding to Time Since Last Bound. -mark_as_volatile_or_releaseIndicates two strategies: Rebuildable resources are set to volatile, and resources no longer needed are released directly. -resource_content_is_emptyCorresponds to the recovery path after purgeable state becomes empty. -reload_resource_content()It must be completed by the game’s own resource system, and session does not provide specific API fragments.
(34:18) Textures also have several clear saving directions: many textures can use 16-bit half precision pixel format; avoid multiple color channels when only alpha is needed; read-only textures can consider block compression, such as ASTC and BC; after A15 Bionic, textures and render targets can also use lossy compression, reducing memory while maintaining quality as much as possible.
(35:10) Storage mode also affects memory. A temporary render target used only in a single pass can be memoryless. Typical examples are depth, stencil or multisampled textures. Textures used only by the GPU, prefer private over shared or managed. The session also reminded that managed mode is not required on Apple silicon Macs, just like iPhone and iPad.
(36:05) If multiple resources will not be used at the same time, aliased resources can be allocated from the heap so that they share the same backing allocation. Seth also reminds you to be very careful about the synchronization of access to these resources.
Core Takeaways
-
**Make a memory budget HUD. ** Display current footprint, peak footprint and available memory in development version of the game. Why it’s worth doing: Session explicitly states that footprint is a core metric for Apple platforms to understand actual memory usage and execution limits. How to start: Use
proc_pid_rusage()readri_phys_footprintandri_lifetime_max_phys_footprint, use on supported platformsos_proc_available_memory()Read available memory. -
**Make level loading a recordable process. ** Write one entry for each typical level
xctrace record --template "Game Memory"Order. Why it’s worth doing: The Game Memory template puts Allocations, Metal Resource Events, and VM Tracker on the same timeline, which is suitable for comparing the memory growth during startup of different resource packages. How to start: Record a 30-second trace for startup, entering the level, and returning to the lobby, and save it to CI or performance test products. -
**Tag VM for custom allocator. ** If the self-developed engine, Unity plug-in or resource system uses anonymous VM, map different uses to app-specific tags. Why it’s worth doing: The session Manifold Garden example shows that unmarked VM_ALLOCATE reduces analysis clarity. How to get started:
mmapPath to default-1Replace withVM_MAKE_TAG(...),mach_vm_allocatePath merges tag into flags. -
**Create memory graph troubleshooting manual. ** Catch first when encountering memory peak
.memgraph, press againfootprint、vmmap、heap、malloc_history、leaksCheck the order. Why it’s worth doing: These tools answer five questions respectively: category, dirty/swapped split, object distribution, allocation stack, and reference relationship. How to start: Record the input, output and next judgment conditions of each command in the team wiki. -
**Perform regular audits of Metal resources. ** Use Metal Debugger Memory Viewer to sort and check Allocated Size and Time Since Last Bound for each milestone. Why it’s worth doing: Metal resources will enter the footprint on Apple silicon, and texture format, storage mode, and purgeable state can all affect actual memory. How to start: first process the maximum texture, then process the long-term unbound resources, and finally check whether the temporary render target can be changed to memoryless.
Related Sessions
- Discover Metal 3 — Introducing the overall capabilities of Metal 3, it is the entry point to understand the Metal Debugger and resource optimization suggestions in this field.
- Go bindless with Metal 3 — Further explanation of heap and resource management. When heap aliasing is mentioned in this session, it is recommended to continue watching.
- Boost performance with MetalFX Upscaling — Discuss how MetalFX reduces rendering pressure, which is suitable for planning image quality strategies together with memory budget.
- Load resources faster with Metal 3 — Pay attention to the streaming loading of resources, which is complementary to the memory growth and resource loading audit during the startup period of this site.
- Maximize your Metal ray tracing performance — Talk about the performance and resource organization of Metal ray tracing, and the background of memory optimization suitable for large-scale scenarios.
Comments
GitHub Issues · utterances