
Highlight
John Crowson from the Performance Tools team used a donut food truck management application as an example to systematically introduce tools for tracking lags at different stages of development.Hang is defined as the period of time when the main thread is busy or waiting for other threads/system resources for more than 250 milliseconds, causing the view to fail to update.
Core Content
Stuttering is most likely to be seen during the development phase.You run the app in Xcode, scroll through the list, and the interface freezes for hundreds of milliseconds.You can see the problem, but you may not know the cause.
It’s even more troublesome after publishing.The devices, networks and system versions in the user’s hands are all different.Stuttering that cannot be reproduced on the desktop may happen on a weak network, old equipment, or an unpopular path.
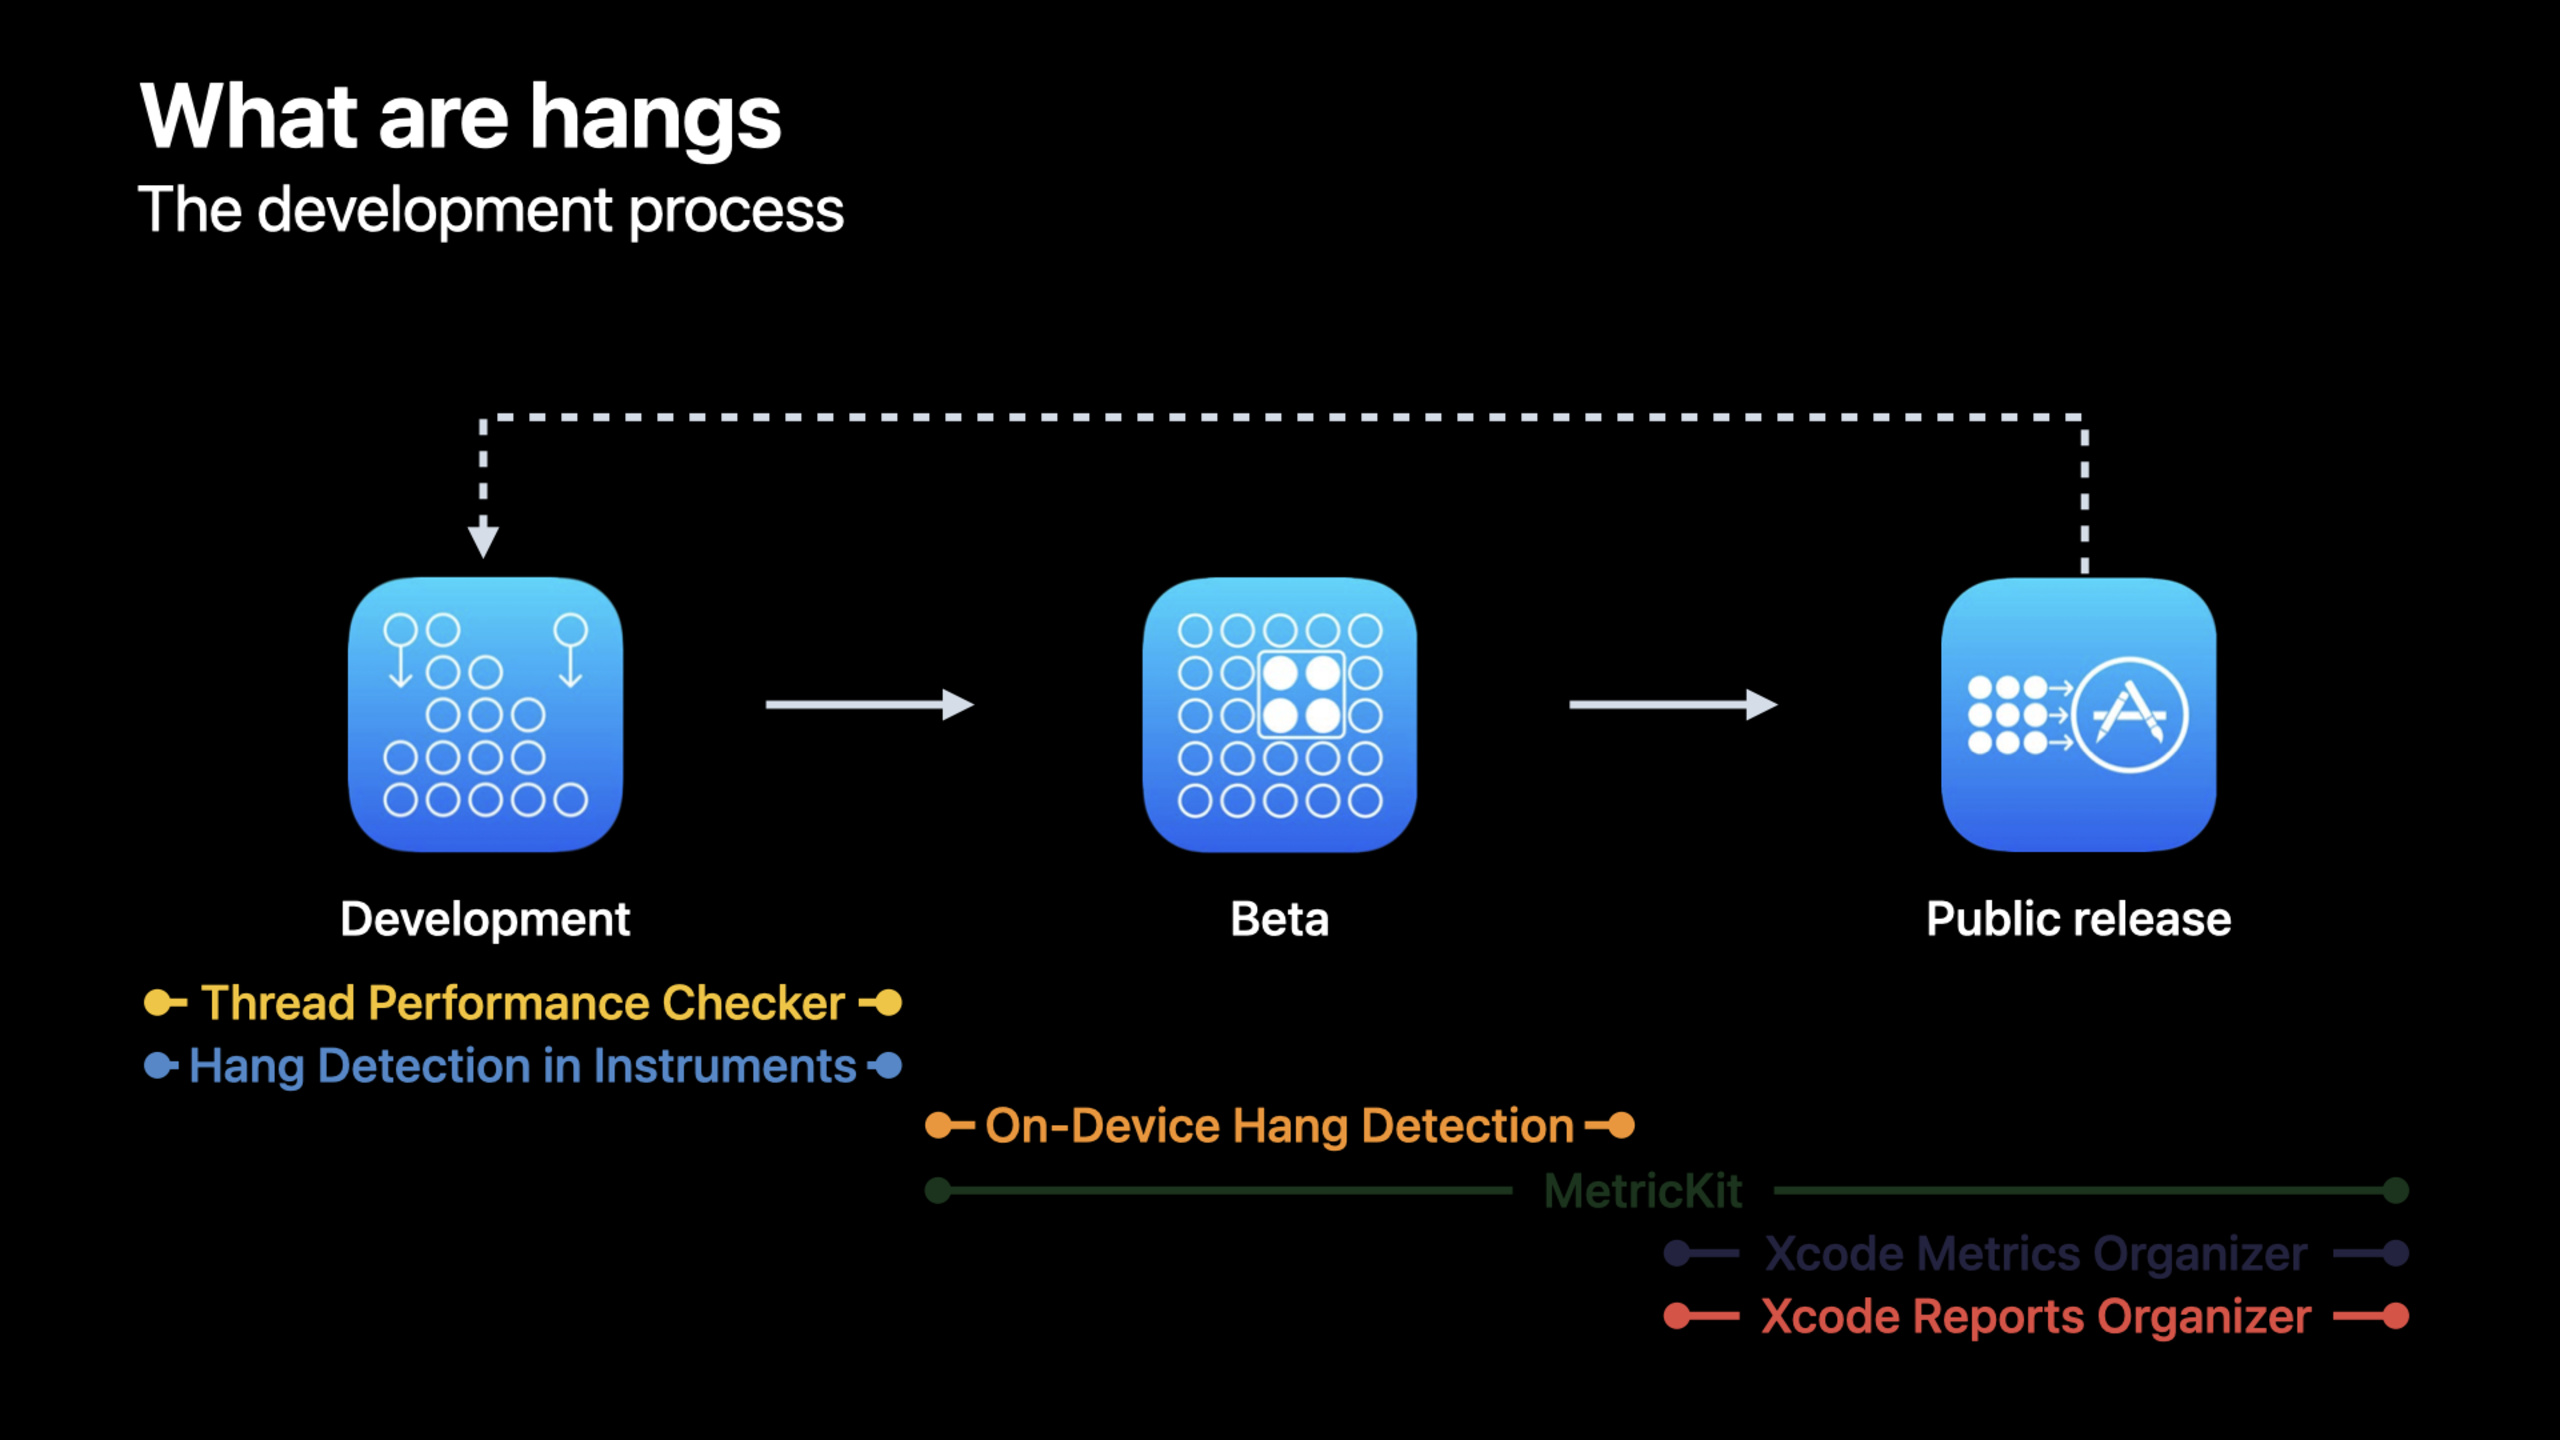
This session breaks down stuck diagnosis into three stages: during development, during beta testing, and after release.Apple has added several types of tools in iOS 16 and Xcode 14 so that each stage has a corresponding signal source.
Use Xcode for the first stage.Thread Performance Checker alerts about priority inversion and main thread non-UI work while debugging.Instruments’ Time Profiler will mark hangs directly on the timeline.
The second stage uses device-side detection.Developing a Signed App or TestFlight App can turn on detection in Settings > Developer > Hang Detection.The device will notify you when a hang occurs, and then generate text hang log and tailspin.
The third stage uses Xcode Organizer.After release, Organizer’s Hang Reports will group main thread stacks collected on user devices by signature and sort them by user impact.
The goal of this link is clear: the earlier it is discovered, the lower the cost; the closer it is to real users, the better the data can illustrate the scope of impact.
Detailed Content
1. First define what hang is
(01:20) Apple’s definition of hang is very specific: the main thread is working, or waiting for other threads or system resources, causing the view content to be unable to be updated for at least 250 milliseconds.
The main thread is also responsible for handling user interaction.While it is occupied, new touch events must also wait.The effect the user sees is that the app is stuck.
The Food Truck App in this presentation pauses while scrolling through a list of donuts.This example corresponds to two common reasons: the main thread waits for a low-priority worker thread, or the main thread performs synchronous network and disk operations.
Conceptual example: hang determination

Main thread is busy or waiting
View update is delayed >= 250 ms
New user interactions wait until the main thread is available
Result: the app appears stuck
Key points:
Main thread is busy or waiting: The source is transcript’s definition of hang. The main thread may be working on its own, or it may be waiting for other threads or system resources.View update is delayed >= 250 ms: 250 milliseconds is the reporting threshold explicitly given by this session.New user interactions wait: When the main thread is unavailable, new user interactions cannot be processed in time.Result: This is not a crash, the process is still alive; what the user feels is that the interface has stopped.
2. Development stage: Thread Performance Checker alarms first
(04:43) Xcode 14’s Thread Performance Checker will prompt two types of hang risks in the Issue Navigator: priority inversion, and non-UI work on the main thread.
The Food Truck App during the presentation triggered the priority inversion prompt.A high priority thread is waiting for a low priority thread.If the main thread is on this waiting chain, scrolling will stop.
The opening location is also very specific: enable Thread Performance Checker in the Diagnostics area of scheme.
Conceptual example: development-stage check

Scheme > Diagnostics
Enable Thread Performance Checker
Run the app in Xcode
Repeat the slow interaction
Inspect the Issue Navigator warning
Key points:
Scheme > Diagnostics: The lecture explains that this tool is launched from the Diagnostics area of the scheme.Enable Thread Performance Checker: This is the new development phase inspection entrance in Xcode 14.Run the app in Xcode: It is suitable for use when connecting to Xcode for debugging, and there is no need to actively record traces.Repeat the slow interaction: Tools expose risk through real interactions, Food Truck’s example being a scrolling list of donuts.Inspect the Issue Navigator warning: Alerts will indicate risks such as priority inversion or non-UI work on the main thread.
The value of this tool is speed.It can’t completely explain for you what the worker thread is doing, but it can narrow the direction of investigation from “slow interface” to “there is a problem with the thread waiting relationship”.
3. Development stage: Time Profiler marks hang on the timeline
(05:56) Next up is Instruments.Time Profiler can display the call stack of each thread over time.In Xcode 14, it will also detect hang and label the corresponding process track.
The investigation steps in the lecture are: Go to Instruments from Product > Profile in Xcode, select Time Profiler, and record the problematic scrolling operation.After the hang label appears on the timeline, triple-click the hang interval to filter the bottom details to this period.
After filtering, John Crowson looks at the main thread CPU first.The main thread has almost no CPU usage, indicating that it is in a waiting state.Looking at other tracks, one worker thread has a high CPU during the hang period.This worker thread is the object to be checked next.
Conceptual example: Time Profiler investigation path

Product > Profile
Choose Time Profiler
Record the problematic interaction
Triple-click the hang interval
Compare main thread CPU with worker thread CPU
Open call stacks in the filtered time range
Key points:
Product > Profile: The lecture enters Instruments through the Xcode menu and uses release to build the startup app.Choose Time Profiler: Time Profiler provides a call stack of threads changing over time.Record the problematic interaction: The recording range should cover reproducible user operations.Triple-click the hang interval: Triple-clicking the hang interval will create a time filter and only view events during the hang period.Compare main thread CPU with worker thread CPU: When the CPU of the main thread is very low, the focus turns to the waiting relationship; when the CPU of the worker thread is very high, check its call stack during the hang period.Open call stacks: Finally, we need to return to the specific function, rather than staying at the conclusion of “hang occurred”.
(08:00) Time Profiler and CPU Profiler support hang detection by default.Xcode 14 also provides an independent hang tracing instrument, which can be added to any trace document and configured with a hang duration threshold.
4. Beta stage: device-side hang detection covers the real environment
(09:08) Desktop debugging has a blind spot: the environment is too ideal.The Food Truck App has no obvious problems under Xcode and a stable network. When it comes to selling donuts outside and the network becomes poor, the order page is stuck for more than three seconds when opening.
iOS 16’s on-device hang detection is used to cover this gap.It works on the device side and does not require that Xcode is connected or that Instruments traces are being recorded.Applicable to developing Signature Apps or TestFlight Apps.
The enable path is Settings > Developer > Hang Detection.Hang Threshold can set the minimum detection duration, as low as 250 milliseconds, or it can be increased to 500 milliseconds or higher.
Conceptual example: on-device detection configuration

Settings > Developer > Hang Detection
Turn on Hang Detection
Set Hang Threshold to 250 ms or higher
Install a development-signed or TestFlight build
Use the app in real-world conditions
Wait for hang notifications and diagnostics
Key points:
Settings > Developer > Hang Detection: This is the system setting path given in the speech.Turn on Hang Detection: When turned on, the device can monitor hangs when there is no Xcode connection.Set Hang Threshold: The minimum threshold is 250 milliseconds; a higher threshold is suitable for giving priority to catching long lags that have a greater impact on users.development-signed or TestFlight build:session clearly limits the scope of support.real-world conditions: The Food Truck example highlights real-world conditions such as weak networks.notifications and diagnostics: The tool issues real-time notifications and provides diagnostic material afterwards.
(10:30) These diagnostics are best-effort.The system will process it in the background with low priority to reduce performance overhead.Diagnostic generation is slower when the device is busy.Passive notifications appear when new diagnostics are available.
5. Beta stage: Use hang log and tailspin to find synchronous calls
(10:58) Device-side detection will provide two types of materials: text hang log and tailspin.
The text hang log has less information, but is suitable for a quick glance.tailspin can be opened in Instruments to observe intra-process thread interactions or view system resource usage.
The text hang log in the lecture shows: During the hang, the main thread called a method that would request the network synchronously.A strong network on the desktop masks the problem; under a weak network, synchronization requests slow down and the main thread is held up.
Conceptual example: from on-device diagnostics to fix direction

Receive an on-device hang notification
Open the generated hang log
Symbolicate the log on a Mac
Find the main thread stack during the hang
Look for synchronous network or disk work
Move that work off the main thread
Key points:
Receive an on-device hang notification: The detection entry comes from notifications on real devices.Open the generated hang log: The text log can first give the stack clue of the main thread when it is hanging.Symbolicate the log on a Mac: During the lecture, the logs were shared to Mac and then symbolized to make it easier to read the function names.Find the main thread stack: The diagnosis of this session focuses on why the main thread cannot update the view.synchronous network or disk work: Synchronous network requests and synchronous disk reads are specific examples in the speech.Move that work off the main thread: Fix directions come from stack facts, not guesswork.
6. Post-launch: Organizer sorts user impact with aggregate reporting
(12:35) After the App is released, Xcode 14’s Organizer supports Hang Reports.The data comes from user devices that have agreed to share App Analytics and includes the main thread stack trace that caused the hang.
Similar stack traces will be classified into the same signature.The list is sorted by user impact.In each signature, you can see the sample hang log, main thread stack, hang duration, device and OS version.It also shows how many hang logs this signature is responsible for, split by OS version and device.
The top signature in the speech accounts for 21% of the hang time in this version.Because symbol information is included when submitting to the App Store, Organizer can display the function names in the source code.John Crowson judged from the main thread call stack that this hang came from the main thread synchronously reading the disk file.
Conceptual example: post-release investigation order

Open Xcode Organizer
Select Hang Reports
Sort signatures by user impact
Open the top signature
Inspect sample hang logs and main thread stack traces
Check OS and device breakdowns
Fix the source code path with the largest impact
Key points:
Open Xcode Organizer: The entrance after publishing is in Organizer.Select Hang Reports: Xcode 14 adds support for hang reports.Sort signatures by user impact: The speech recommends prioritizing the top signatures that most impact customers.Open the top signature:signature is a grouping of similar stack traces.sample hang logs and main thread stack traces: Sample logs are used to locate specific code paths.OS and device breakdowns: Split information to help determine whether the problem is focused on a specific system or device.largest impact: Fix order is determined by real user impact.
(15:21) To make Organizer reports readable, Apple recommends that you include symbol information when submitting to the App Store.It will display the function name in the report and support one-click jump from the stack trace function to the Xcode source code.The extracted information is limited to function and method names, source code paths, and line numbers, and will be stored securely and will not be shared.
Core Takeaways
1. Add a “main thread physical examination” to each new function
- What to do: Before the new page is merged, use Thread Performance Checker and Time Profiler to run a core interaction.
- Why it’s worth doing: Session emphasizes that priority inversion and non-UI work on the main thread can be found during the development phase. The earlier it is repaired, the lower the cost.
- How to start: Open the Thread Performance Checker in the Diagnostics of the scheme; record Time Profiler for high-frequency operations such as list scrolling, page opening, and search input.
2. Turn weak network testing into a beta checklist
- What to do: During TestFlight testing, open the order, details, search and synchronization pages in weak network or network switching scenarios.
- Why is it worth doing: The synchronous network request in the Food Truck example is not obvious under a strong desktop network, and it will only trigger a hang for more than three seconds in a real environment.
- How to start: Open detection in Settings > Developer > Hang Detection of the test device, set the threshold to 250ms or 500ms, and collect the hang log after notification.
3. Establish a top signature processing rhythm for post-release issues
- What to do: Check the Hang Reports of Xcode Organizer after each release, and process the signature that accounts for the highest proportion of hang time first.
- Why it’s worth doing: Organizer will sort by user impact, and the top signature in the speech accounts for 21% of the hang time of this version.
- How to start: Check Hang Reports regularly after release; open top signature, read the sample hang log, device and OS split, and then return to the corresponding source code path to fix it.
4. Treat symbol information as part of performance diagnosis
- What: Preserve symbol information when submitting to the App Store.
- Why is it worth doing: Organizer needs it to restore the stack frame in the report to the function name, and support jumping to the Xcode source code.
- How to start: Check the archiving and uploading process to confirm that the symbol information is submitted with the App; use Organizer after release to verify that the hang report can display the function name.
5. Establish code review rules for synchronous I/O and synchronous networking
- What: Flag synchronous network requests on the main thread, synchronous disk reads, and thread synchronization that may cause waits during code review.
- Why is it worth doing: Two specific cases of session come from synchronous network requests and synchronous reading of disk files by the main thread.
- How to start: Add “Whether the main thread is waiting for the network, disk, or low-priority threads” to the review checklist; when in doubt, use Instruments’ hang interval filtering to verify.
Related Sessions
- Understand and eliminate hangs from your app — First learn the causes of hangs and common repair directions, and then return to this session to select the corresponding diagnostic tool.
- What’s new in MetricKit — MetricKit provides hang diagnostics as part of the post-release performance data link.
- Diagnose performance issues with the Xcode Organizer — Explain how the Organizer displays aggregated performance metrics on real user devices.
- Identify trends with the Power and Performance API — If you want to connect Organizer and performance trends to your internal system, you can continue to look at the Power and Performance API.
Comments
GitHub Issues · utterances