
Highlight
Session takes a travel subscription app called “Mountain Climber” as an example to introduce the new benchmarking function of App Analytics. Developers can see the trends of various indicators of their apps in App Analytics, but they lack a frame of reference - is a 5.5% increase in conversion rate considered good or bad? Benchmarking fills this gap.
Core Content
App Analytics turns out to be able to tell you your own trends. Mountain Climber, a travel subscription app, increased conversion rates by 5.5% in the past 90 days. The problem is that there is still a lack of reference for the upward trend: is this result already leading, or is it still in the second half of its peers (01:15).
App Benchmarking completes this frame of reference. It puts your app into a peer group of similar apps, and then displays the 25th, 50th, and 75th percentile to let you know your relative position in the same group. Although the conversion rate of Mountain Climber is improving, it is still in the bottom half of the peer group, which shows that there is still room for customer acquisition (02:14).
This set of capabilities is geared toward business decisions. Developers can split the indicators into four categories: customer acquisition, usage, quality, and monetization, and then use other App Store tools to take action: product page optimization, custom product pages, in-app activities, App Clips, price tiers, and promoted in-app purchases (08:33).
Detailed Content
1. Use peer group to determine growth space
(02:14) The first thing in Benchmarking is to change the performance of the App from “Comparing myself with myself” to “Comparing myself with similar apps”. The similarity in Session comes from two dimensions: App Store category and monetization model. Mountain Climber belongs to the travel category and is a subscription App, so it will be placed together with similar travel subscription apps (06:29).
Below is a conceptual analysis checklist. It is not an API, it just writes the workflow in the session into steps that the team can execute.
Concept example: peer group diagnostic checklist
1. Choose a business metric: conversion rate
2. Confirm peer group dimensions: travel category + subscription model
3. View percentiles: 25th, 50th, 75th
4. Compare this app position: bottom half / above median / top quartile
5. Decide the next step: keep optimizing acquisition, or move resources to other metrics
Key points:
- In line 1, define the indicators first to avoid confusion in judgment caused by discussing customer acquisition, retention, and monetization at the same time.
- Line 2 corresponds to category and monetization model in transcript. These two attributes are used to create more relevant peer groups.
- Row 3 corresponds to the 25th, 50th, and 75th percentiles displayed by App Benchmarking.
- Line 4 converts the absolute value into a relative position. The example of Mountain Climber is the bottom half.
- Line 5 turns insights into resource allocation decisions: stay invested in the current direction, or move to a weaker link.
2. Four sets of indicators cover the user life cycle
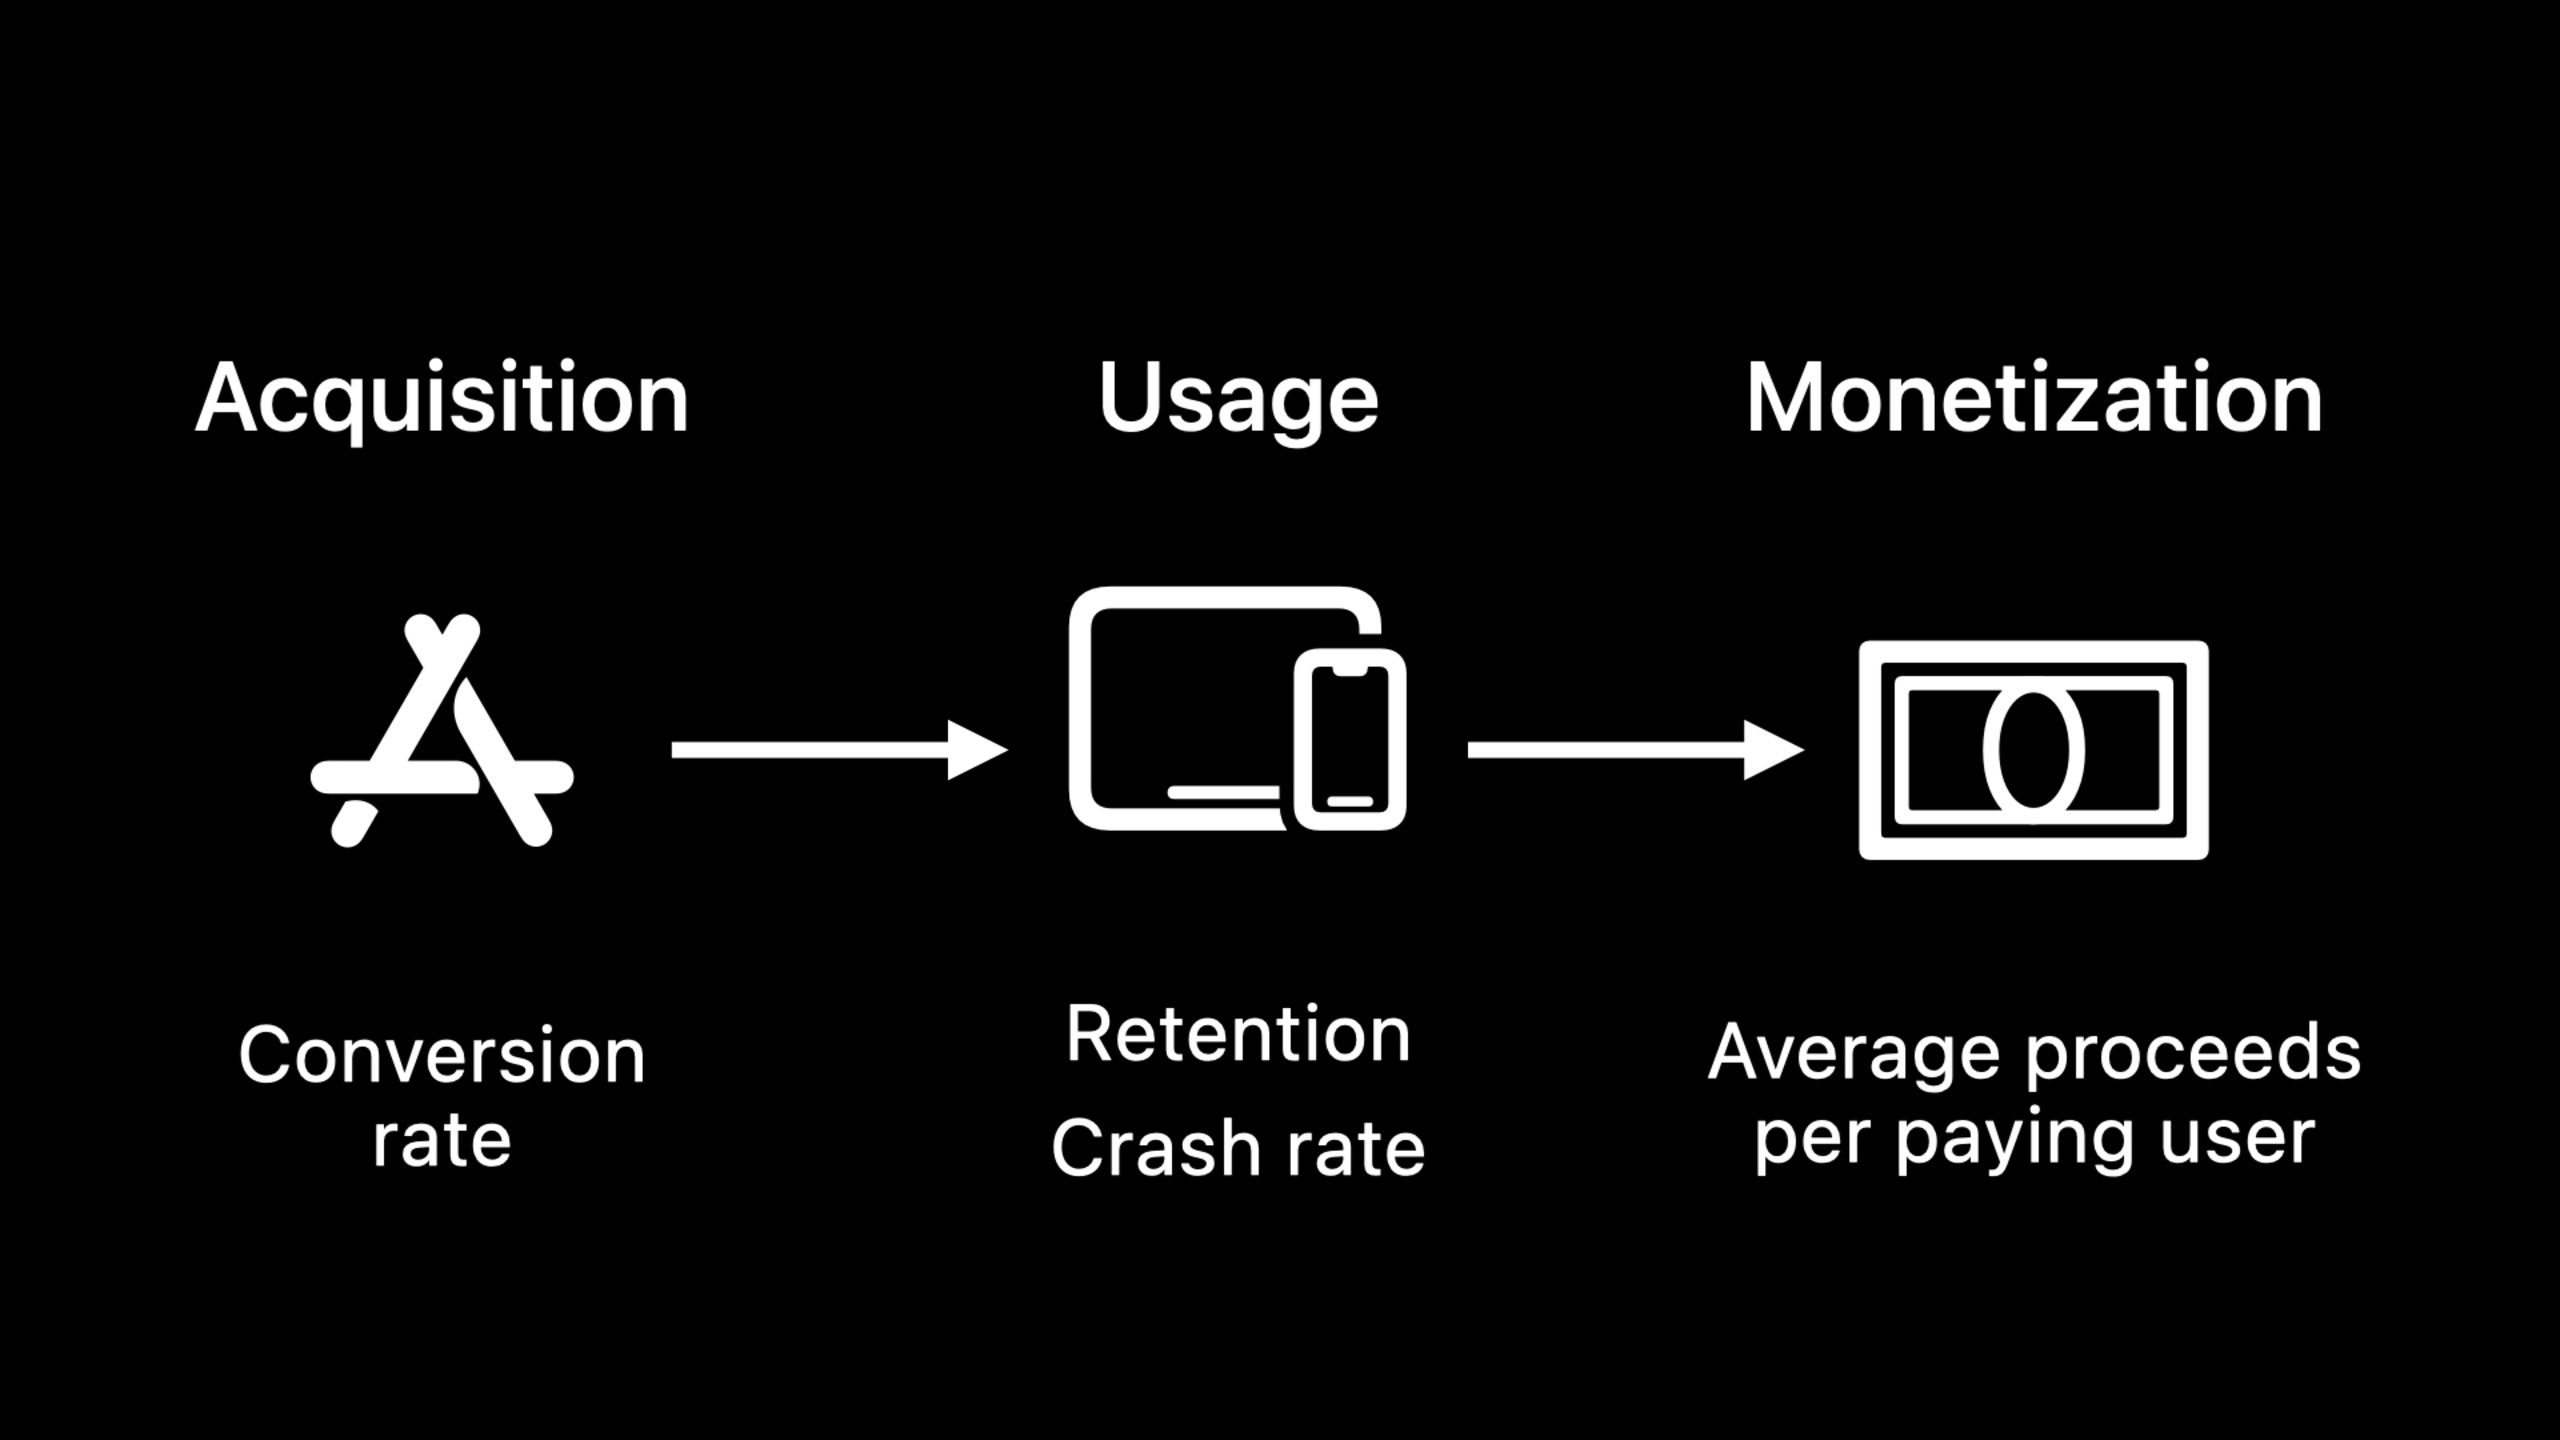
(04:05) Apple maps benchmark indicators to customer lifecycle. For customer acquisition, look at conversion rate; for usage, look at Day 1, Day 7, and Day 28 retention; for quality, look at crash rate; and for monetization, look at average proceeds per paying user.
There is a sequential relationship between these indicators. Conversion rate answers “How many people downloaded or re-downloaded the product page after seeing it?” Save the answer “How many people come back on the 1st, 7th, and 28th day after downloading”. Crash rate answers “Are quality issues driving down engagement and monetization?” Average paying user revenue answers “What is the level of revenue per paying user” (04:22).
Concept example: read benchmarks by lifecycle
Acquisition  -> conversion rate
Usage        -> Day 1 / Day 7 / Day 28 retention
Quality      -> crash rate
Monetization -> average proceeds per paying user
Key points:
AcquisitionCorresponds to the stage from user exposure to App Store to download or re-download. -UsageUse three retention windows to see if your app keeps users coming back. -QualityLook at crash rate alone, as crashes affect engagement and monetization. -MonetizationUse average proceeds per paying user to compare paying user contributions.
3. Relevance comes from classification and business model
(05:55) The value of a Peer group depends on relevance. Put a travel subscription app and a one-time payment tool app together and the user behavior is expected to be different. Session clearly mentioned that Apple will use existing attributes on the App Store to create peer groups, including App Store category, and monetization models such as free, freemium, paid, paidmium, subscription, etc. (06:29).
Apple also tests the properties used for grouping to ensure they provide meaningful comparisons over time. The key point here is to understand the grouping context before reading the benchmark: what you see is a comparison of apps that are closer to the business form.
Concept example: confirm context before reading benchmarks
App category: Travel
Monetization model: Subscription
Business question: does conversion rate still have room to improve?
Benchmark view: peer group percentile distribution
Key points:
App categoryFrom the App Store category, the session example uses Travel. -Monetization modelTo influence user behavior expectations, subscription apps should not simply be compared to paid apps. -Business questionWrite it clearly before you can decide which benchmark to look at. -Benchmark viewWhat is returned is the distribution location of the peer group and does not expose the performance of a single App.
4. Privacy protection relies on differential privacy
(07:23) Benchmarking needs to show the overall performance of the peer group without leaking any single App data. Apple uses differential privacy here. The explanation in the Session is very specific: When calculating the overall conversion rate of the peer group, a small amount of noise will be added to the shared data points and ensure that there are enough apps in the group (07:36).
The goal of this is to make the aggregated information still useful, while making it impossible for outsiders to determine whether a specific App is in this group, nor to restore the precise performance of an App.
Concept example: privacy boundaries of Benchmarking
Input: many similar apps in one peer group
Process: aggregate metrics + small amounts of noise
Output: 25th / 50th / 75th percentile distribution
Hidden: individual app membership and individual app performance
Key points:
InputThere should be enough similar apps that a single app should not be isolated. -ProcessCorresponds to the practice of adding noise to differential privacy. -OutputIt is percentile distribution, giving developers relative position. -Hiddenis a privacy goal: not to disclose the membership or performance of any individual app.
5. Benchmark is only responsible for pointing out the direction, and action depends on other App Store tools
(08:33) The last paragraph of Session connects benchmark and action. If the conversion rate is low, you can look at the product page first. Product Page Optimization can test different combinations of icons, screenshots, and app previews; Custom Product Pages can create different product pages for different audiences (09:02).
For weak retention or usage metrics, use in-app events and App Clips. The former displays in-app activities such as game competitions, movie premieres, and live broadcast experiences to the App Store; the latter allows users to complete a quick task in relevant public scenes. If the monetization indicator is weak, you can test different pricing tiers, or create promoted in-app purchase, allowing users to browse purchasable items in the App Store before downloading (09:33).
Concept example: from benchmark to action
If conversion rate below peer median:
  Try Product Page Optimization
  Try Custom Product Pages

If retention below peer median:
  Try In-app Events
  Try App Clips

If average proceeds per paying user below peer median:
  Try pricing tiers
  Try promoted in-app purchases
Key points:
- The first set of actions directly serves the conversion rate of the product page and corresponds to the acquisition indicator in the session.
- The second set of actions serves engagement and re-engagement, corresponding to Day 1/7/28 retention.
- The third group of action services pay user income, corresponding to average proceeds per paying user.
- These are App Store side tools, not in-app SDK calls.
Core Takeaways
-
**What to do: Create a monthly App Analytics review template. ** Why it’s worth doing: Benchmarking gives a relative position, and the team can change from “increase or decrease in value” to “change in gap with peer group”. How to start: Record the percentile position of conversion rate, Day 1/7/28 retention, crash rate, and average proceeds per paying user every month, and write down which indicator is only optimized this month.
-
**What to do: Run product page experiments for apps with conversion rates below the median. ** Why it’s worth doing: Session clearly uses Product Page Optimization and Custom Product Pages as the entrance to improve conversion rate. How to start: First design a Product Page Optimization test for App icon, screenshots, app previews, and then create a Custom Product Page for a clear audience.
-
**What to do: Connect the retention benchmark to the App Store operating plan. ** Why it’s worth doing: Day 1, Day 7, and Day 28 retention can indicate whether users come back, and in-app events can re-reach users in the App Store. How to get started: If Day 7 or Day 28 retention is behind a peer group, pick a limited-time content, contest, live broadcast, or premiere event and configure it as an in-app event.
-
**What to do: Put the crash rate into the growth dashboard. ** Why it’s worth doing: Session mentioned that a high crash rate will affect engagement and monetization and should not be viewed only internally by the engineering team. How to start: In the growth review, put the crash rate benchmark on the same page as retention and monetization. Fix high-frequency crashes first, and then evaluate whether retention has improved.
-
**What to do: Test price tiers for subscription apps. ** Why it’s worth doing: Average proceeds per paying user can indicate whether the monetization strategy is weaker than similar apps. How to start: When this indicator is lower than the peer median, design a clearer set of subscription tiers or promoted in-app purchase display plans, and then observe the changes in paying user revenue.
Related Sessions
- What’s new in App Store Connect — App Analytics and Benchmarking are both part of the App Store Connect workflow and work together to understand submissions, operations, and API updates.
- What’s new with SKAdNetwork — Continue to look at customer acquisition and advertising attribution data under the premise of privacy protection.
- Explore App Tracking Transparency — Understand the boundaries of tracking, authorization, and privacy policies in the App Store ecosystem.
- What’s new with in-app purchase — When benchmarks point to monetization issues, StoreKit and App Store Server API updates are the entry points for follow-up action.
Comments
GitHub Issues · utterances