
Highlight
The Core ML workflow breaks down into three steps: choose a model, integrate it into your app, and optimize performance. This year’s updates cover all three stages.
Core Content
Core ML performance issues often show up after the model is already running. A model that can predict is not necessarily suitable for real-time camera, interactive filters, or low-latency interfaces. Developers need to know how long model loading takes, how long each prediction takes, and which layers run on the CPU, GPU, or Neural Engine.
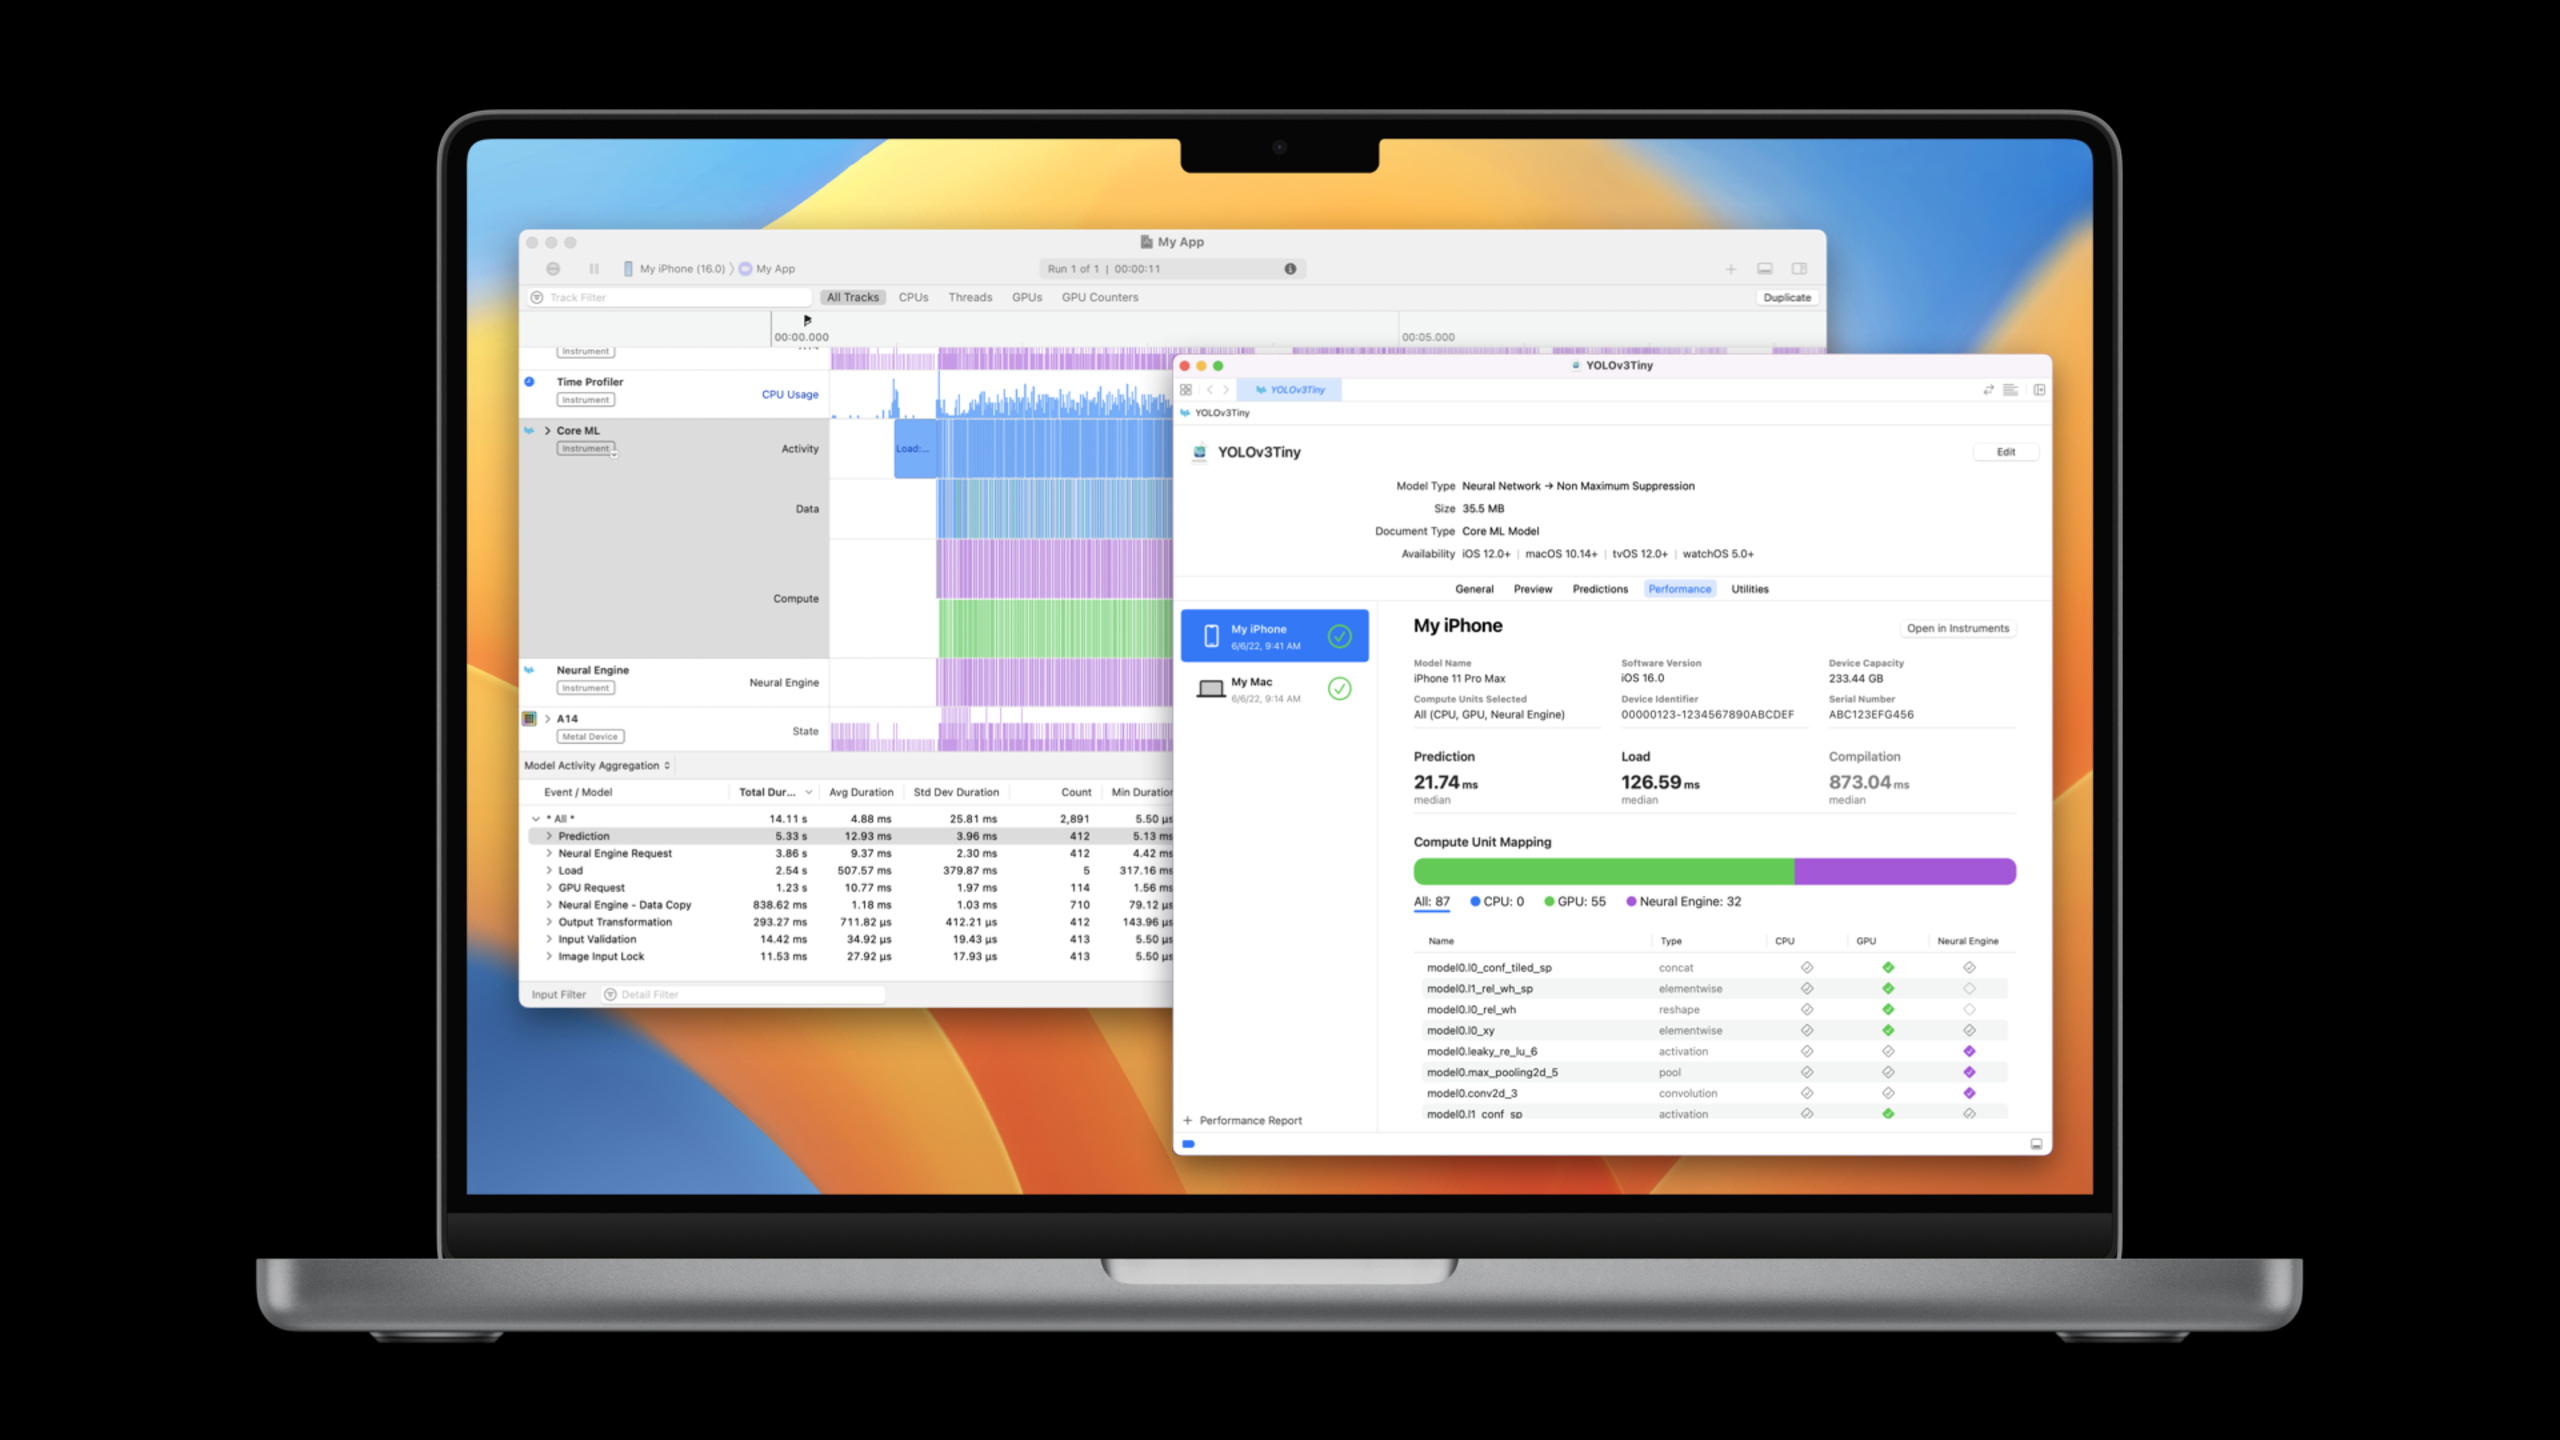
This session breaks Core ML usage into three steps: choose a model, integrate the model, and optimize how you use it. Xcode 14’s model viewer adds a Performance tab, letting developers send a model to a real device and generate performance reports for compile, load, and prediction before writing app code.
Once the model is in the app, performance bottlenecks become more concrete. In the demo, a style transfer app had low frame rate. Core ML Instrument showed total model load time exceeding total prediction time. The cause was a computed property for the model attribute, which reloaded the model before every prediction. After switching to lazy var, load count dropped to once per style.
At the API level, iOS 16 and macOS Ventura add Float16 input/output support, output backing, the cpuAndNeuralEngine compute unit, ML Program weight compression, in-memory model loading, and automatic compile-and-package of Core ML models in Swift Packages. The shared goal is clear: reduce data conversion, reduce repeated allocation, and make models easier to distribute.
Detailed Content
Use Performance Report to judge whether a model fits your scenario
(03:39) In the past, evaluating model performance often meant integrating the model into an app first, or writing a small prototype and measuring with Instruments. Xcode 14 moves this earlier into the model viewer.
The Performance tab workflow is: select a target device, select Core ML compute units, and click Run Test. Xcode sends the model to the device, runs compile, load, and prediction multiple times, then generates a report.
In the demo, the YOLOv3 model had a median prediction time of 22.19 ms on iPhone, median load time around 400 ms, and on-device compile time around 940 ms. A 22 ms prediction time corresponds to roughly 45 FPS for real-time video.
Conceptual workflow from the Performance tab demo:

1. Select target device: iPhone
2. Select compute units: All
3. Run test: Run Test
4. Read the report:
   - median prediction time
   - median load time
   - compilation time
   - layer placement on CPU / GPU / Neural Engine
Key points:
- Step 1 puts the test on real hardware, because Core ML performance depends on the device.
- Step 2 controls which compute units Core ML may use.
- Step 4’s prediction time judges real-time suitability; load time and compilation time judge startup or first-use cost.
- Layer placement shows which compute unit each layer actually runs on; in the demo, 54 layers ran on GPU and 32 on Neural Engine.
Use Core ML Instrument to find real bottlenecks in your app
(07:32) A Performance Report only shows what the model can do in isolation. Once the model is in the app, you also need to check whether calling patterns waste time.
Xcode 14 Instruments adds a Core ML template. It includes Core ML Instrument and works with other Instruments to analyze model execution. Core ML Instrument groups events into three categories: Activity, Data, and Compute.
- Activity corresponds to Core ML APIs you call directly, such as load and prediction.
- Data shows data checks or conversions Core ML performs for inputs and outputs.
- Compute shows compute requests Core ML sends to the Neural Engine or GPU.
In the demo style transfer app, the Aggregation view showed 6.41 seconds total load time and 2.69 seconds total prediction time. That ratio shows the problem is not single prediction time, but repeated loading.
// Conceptual example: problematic pattern from the transcript
// Reading styleTransferModel recomputes the property and reloads the model every time.
var styleTransferModel: MLModel {
    loadSelectedStyleTransferModel()
}

// Conceptual example: fix direction from the transcript
// Load on first use, then reuse the in-memory model.
lazy var styleTransferModel: MLModel = {
    loadSelectedStyleTransferModel()
}()
Key points:
var styleTransferModel: MLModel { ... }is a computed property; accessing it runs the code block.loadSelectedStyleTransferModel()represents model loading work; in a computed property it repeats before every prediction.lazy varinitializes on first access, then reuses the same model instance.- The transcript’s verification result: after the fix, only 5 load events remained, matching the 5 styles used in the app.
(12:43) Core ML Instrument can also break activity down by model. For an app with one model per style, this separates load and prediction per model.
You can drill down further. The demo pinned Core ML Instrument, GPU Instrument, and the new Neural Engine Instrument together. The Core ML interval showed the full prediction region; Neural Engine Instrument showed the first half of compute, GPU Instrument the second half, so developers could see the handoff from Neural Engine to GPU.
Use Float16 input/output to reduce data conversion
(14:34) Core ML previously supported 8-bit grayscale, 32-bit color images, and Int32, Double, and Float32 MultiArrays. Problems appeared when the app already used Float16 data.
In the demo, an image sharpen filter did pre- and post-processing on GPU with single-channel OneComponent16Half. The old model interface was still 8-bit grayscale, so the app had to downcast input from OneComponent16Half to OneComponent8, then upcast output back to OneComponent16Half. Inside Core ML, the 8-bit input was converted to Float16 again for compute.
Starting in iOS 16 and macOS Ventura, Core ML natively supports OneComponent16Half grayscale images and Float16 MultiArrays. During model conversion you can specify the new image color layout or MultiArray data type. Minimum deployment target must be iOS 16 or macOS Ventura.
Conceptual workflow from the Float16 demo:

Old model:
OneComponent16Half input in app
  -> app downcast to OneComponent8
  -> Core ML convert to Float16 for compute
  -> Core ML produce OneComponent8 output
  -> app upcast to OneComponent16Half

New model:
OneComponent16Half CVPixelBuffer input
  -> Core ML prediction
  -> OneComponent16Half CVPixelBuffer output
Key points:
- The old flow had app-side downcasting and upcasting, plus Core ML internal data preparation.
- The new flow lets the model interface accept Float16 grayscale buffers directly.
- The transcript explicitly states that passing a
OneComponent16Half CVPixelBufferdirectly does not cause data copies or conversion. - After the change, the Data lane in Instruments no longer showed the previous conversion steps.
Use output backing to control output buffers
(18:42) Core ML also adds an output backing API. You can pre-allocate an output buffer, set it on prediction options, and have Core ML write into that buffer instead of creating a new output on every prediction.
Conceptual pseudocode from the transcript's output backing usage:

outputBuffer = outputBackingBuffer()  // returns OneComponent16Half CVPixelBuffer
predictionOptions = new prediction options
predictionOptions.setOutputBacking(outputBuffer, forModelOutputName)
result = model.prediction(inputBuffer, options: predictionOptions)
Key points:
outputBackingBuffer()corresponds to the function in the demo, returningOneComponent16Half CVPixelBuffer.predictionOptionsis the options object passed to prediction.setOutputBackingis pseudocode expressing “set the pre-allocated output buffer on prediction options”; it does not assume a specific Swift API name.model.prediction(inputBuffer, options: predictionOptions)corresponds to “call the prediction method on my model with those prediction options” in the transcript.forModelOutputNamedepends on the generated interface and model output names.
(20:11) Apple also recommends using IOSurface-backed buffers when possible. Core ML can then use unified memory to reduce copies when data moves between compute units.
Other Core ML integration capabilities
(20:31) The ML Program model type extends 16-bit and 8-bit weight compression and adds sparse representation. coremltools utilities can quantize, palettize, and sparsify ML Program weights.
(21:09) MLModelConfiguration’s computeUnits adds cpuAndNeuralEngine. If your app heavily uses the GPU, you can keep Core ML off the GPU and limit compute to CPU and Neural Engine.
// Conceptual example: Core ML compute units that avoid GPU
let configuration = MLModelConfiguration()
configuration.computeUnits = .cpuAndNeuralEngine

let model = try MyModel(configuration: configuration)
Key points:
MLModelConfigurationis the Core ML model loading configuration.computeUnitscontrols Core ML’s compute unit preference..cpuAndNeuralEngineis the new option mentioned in the session.- Use it when the GPU is already occupied by rendering, video, or other compute in your app.
(21:44) Core ML also adds in-memory model loading. You can store model data with a custom encryption scheme, decrypt before loading, and compile and load from an in-memory Core ML model specification without writing the compiled model to disk first.
(22:11) Xcode 14 supports putting Core ML models in Swift Packages. When others import the package, Xcode automatically compiles and packages models and generates familiar code interfaces. This lowers the cost of distributing reusable models in the Swift ecosystem.
Core Takeaways
-
Build a real-time camera filter performance panel: List load count, prediction time, and Data lane events for each filter’s Core ML model. This quickly shows whether slow filter switching comes from model loading or input/output conversion.
-
Build a model candidate evaluation table: During model selection, use Xcode Performance Report to record prediction time, load time, and layer placement across devices and compute units. Good for object detection, pose recognition, real-time segmentation, and other frame-rate-sensitive features.
-
Switch a GPU image pipeline to Float16 end-to-end: If pre- and post-processing already use
OneComponent16Halfon GPU, reconvert the model so Core ML accepts Float16 images or Float16 MultiArrays directly, reducing app-side conversion and Core ML Data lane conversion events. -
Reuse output buffers for high-frequency prediction: For video, audio, or sensor stream models, pre-allocate output backing buffers and reuse them at prediction time. Fits features that call models many times per second, such as real-time enhancement, motion analysis, and continuous classification.
-
Package reusable models as Swift Packages: Put models, calling code, and sample inputs/outputs in a package so multiple apps in your team share the same Core ML integration. Xcode 14 handles model compile, packaging, and code generation.
Related Sessions
- Explore the machine learning development experience — Covers model discovery, conversion, validation, and on-device tuning; a good prerequisite for this session.
- Get to know Create ML Components — Shows how to train custom models with Create ML Components; after training, use this session’s tools to evaluate and optimize Core ML integration.
- Compose advanced models with Create ML Components — Demonstrates more complex Create ML Components composition for deploying temporal data models to Core ML.
- What’s new in Vision — Vision APIs are commonly used for image and video intelligence; upper-layer Vision pipeline performance is also affected by model choice, data format, and hardware execution.
Comments
GitHub Issues · utterances