
Highlight
Instruments 13 adds the HTTP Traffic Instrument to the Network template, allowing developers to view the HTTP traffic of the app by process, URLSession, URLSessionTask and HTTP transaction, and use the same trace to locate performance issues, cache errors, authentication issues and privacy risks.
Core Content
Network problems of an App often do not appear directly in the code.
Images load slowly, and I only see one group in the codeURLSessionTask. The user logs in repeatedly, and the code only shows that the server returns 401. The favorites list is not updated and the interface looks like a status management bug. Third-party SDKs secretly send data, and the source code is not even in your project.
In the past, troubleshooting these problems required switching back and forth between client logs, server logs, and proxy packet capture tools. Each tool only sees part of the truth. You know the request was sent, but you don’t necessarily know who it belongs toURLSession. You see the HTTP header, but you don’t necessarily know which line of code calledresume()。
Apple has added HTTP Traffic Instrument to the Network template in Instruments 13. It connects directly to the Apple Networking stack and records HTTP traffic passing through the URL Loading System. HTTP/3, VPN traffic, disk cache hits, network errors, all appear on the same timeline.
This talk is demonstrated using a dog photo app. The home page loads slowly because the server only supports HTTP/1.1, causing requests on the same connection to be queued. The login status was lost because the server sent back an expired cookie. The collection list is not refreshed because the request directly hits the local cache. Third-party login SDK uploads location coordinates before the user clicks, which is a privacy issue.
The key change is that network requests are no longer just URLs and status codes. Instruments puts it back into the object model that developers are familiar with: processes,URLSession、URLSessionTask, transaction (an HTTP request and response). You can see the problem from the timeline, and you can also trace back to the source code from the backtrace.
Detailed Content
1. Read HTTP traffic at the object level
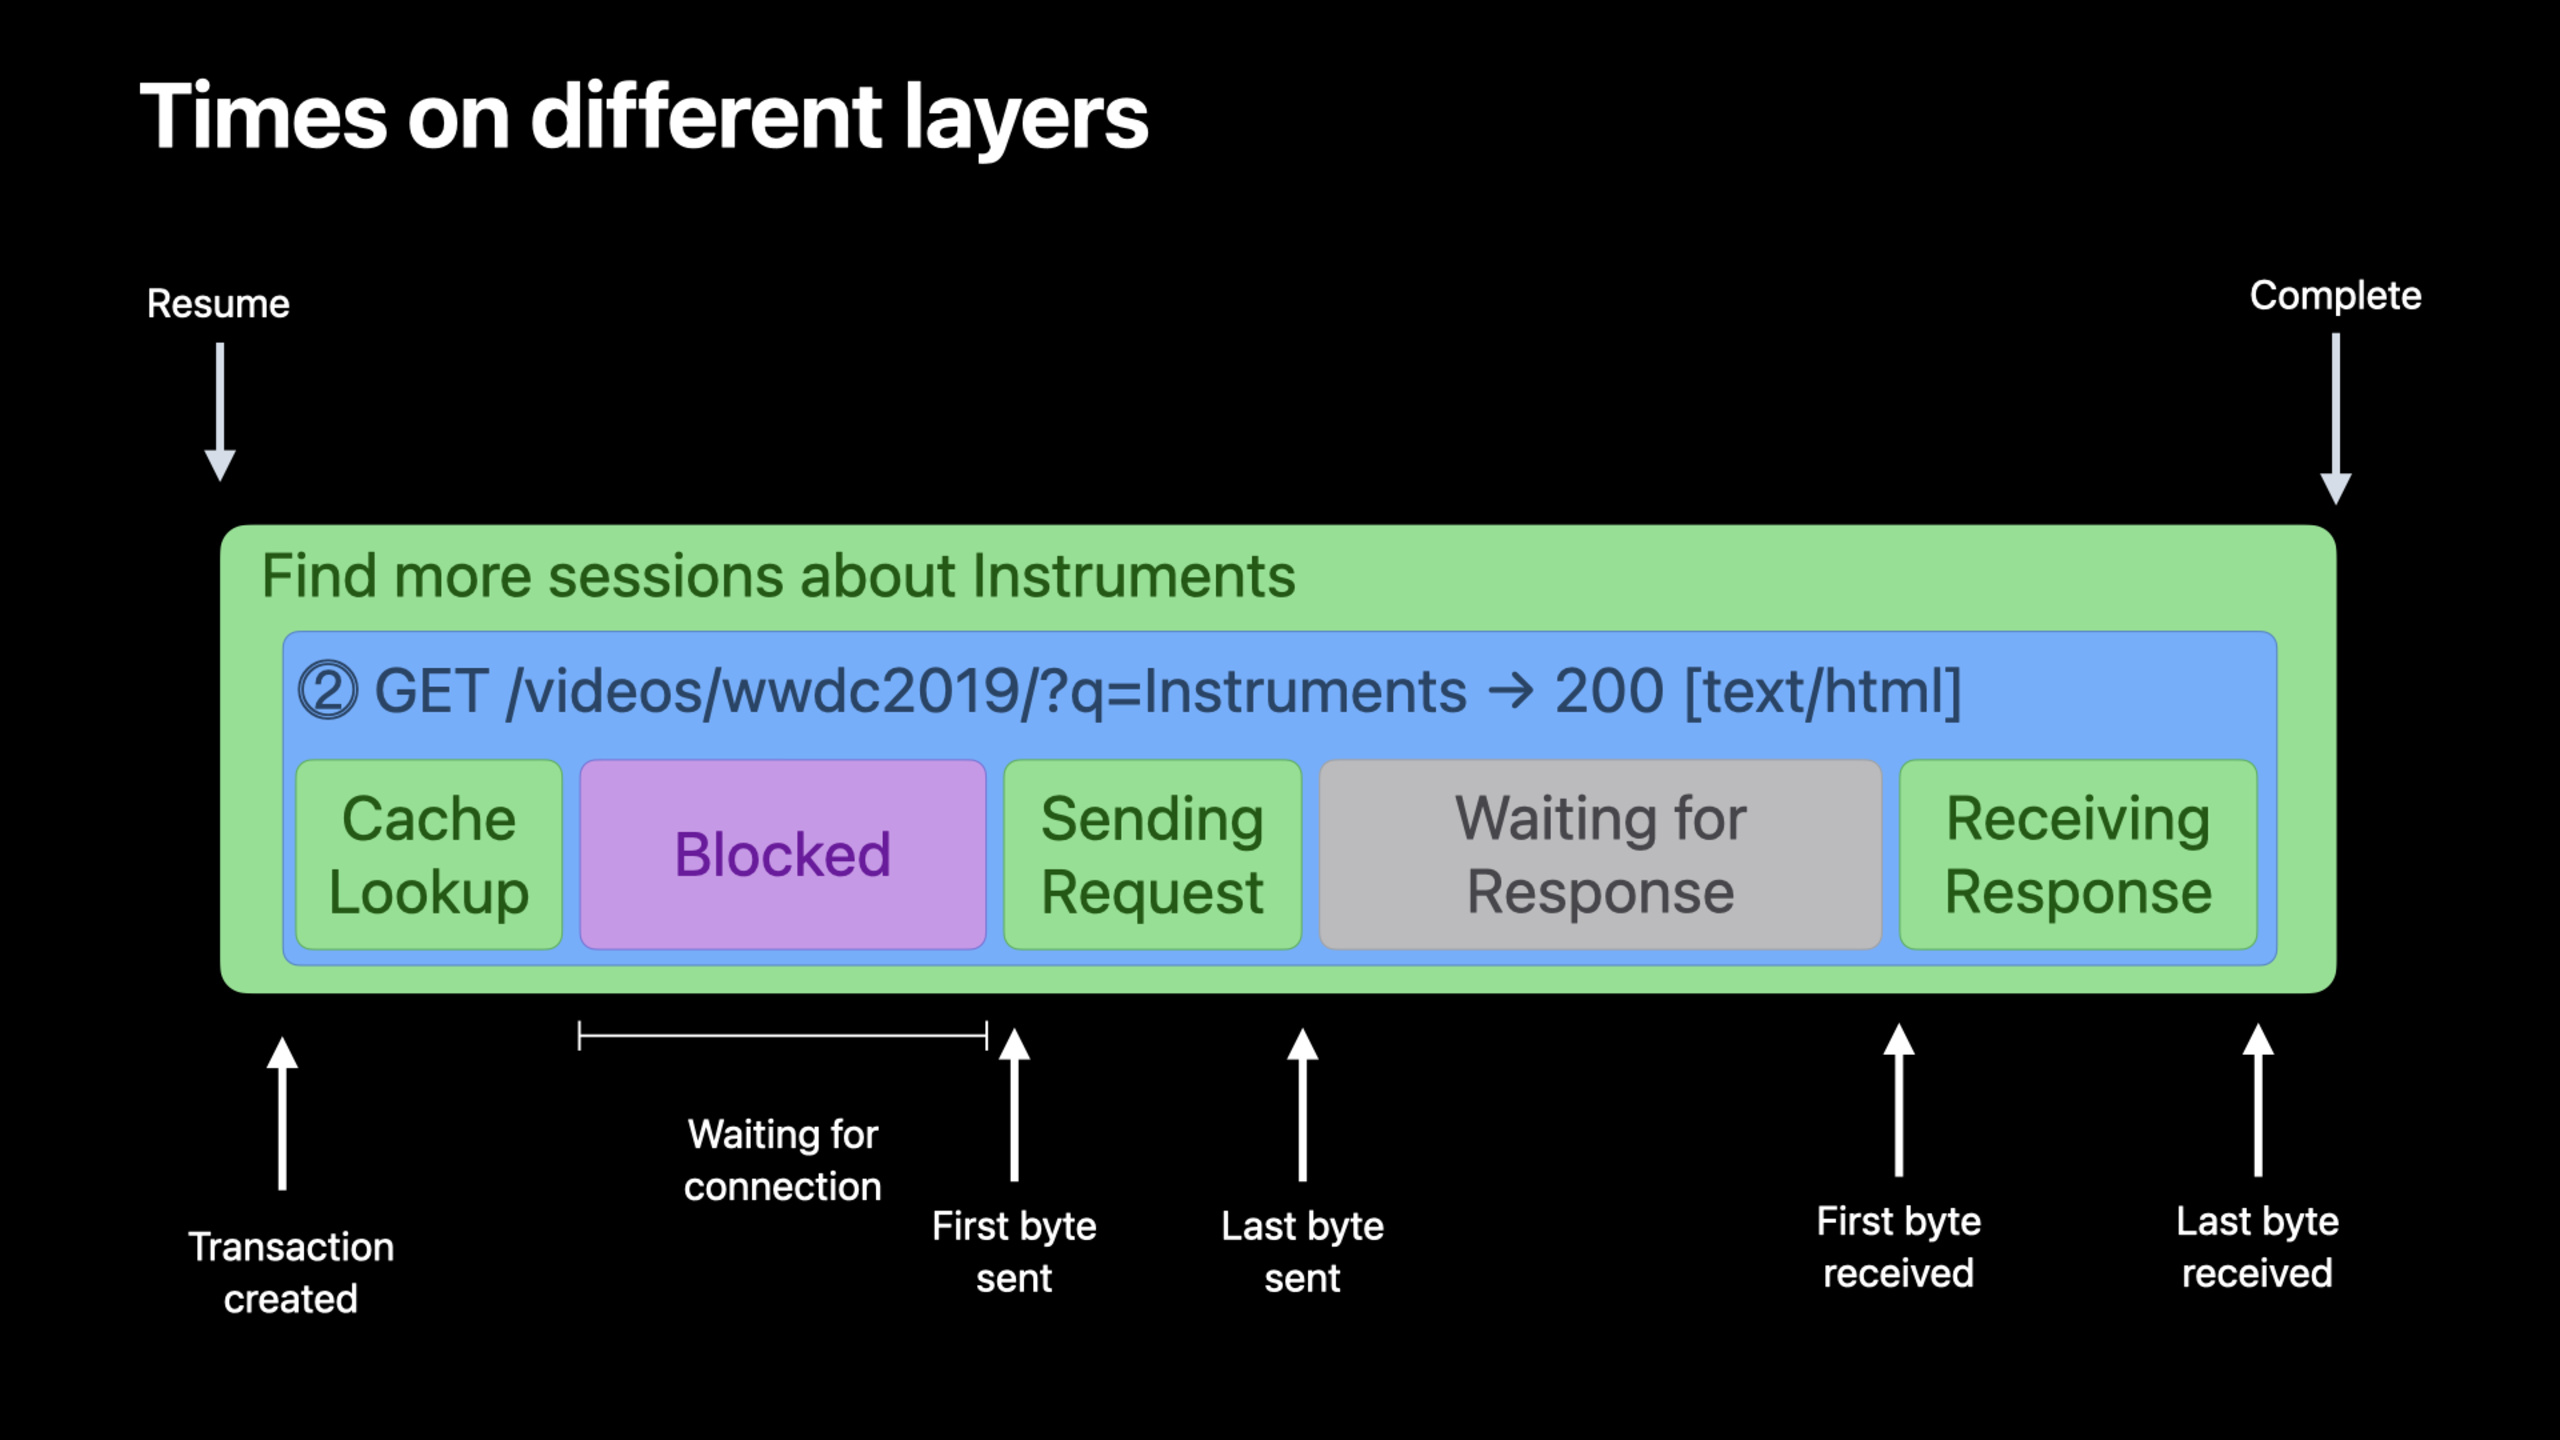
(02:04) The top track of the HTTP Traffic Instrument shows what is running in the traceURLSessionTaskquantity. The next layer is split by process, and the next layer is used by the process.URLSession. The bottom layer is split by request domain name and displays the status of tasks and transactions.
If there are multiple sessions in the project, the default names are difficult to correspond to the code. Apple recommends giving sessions and tasks semantic names. Instruments will label the timeline with these names.
import Foundation

final class FeedLoader {
    private let session: URLSession

    init() {
        let configuration = URLSessionConfiguration.default
        session = URLSession(configuration: configuration)
        session.sessionDescription = "DogFeed Image Loader"
    }

    func loadThumbnail(from url: URL) {
        let task = session.dataTask(with: url) { data, response, error in
            if let error {
                print("thumbnail failed: \(error)")
                return
            }

            print("thumbnail bytes: \(data?.count ?? 0)")
        }

        task.taskDescription = "Load latest dog thumbnail"
        task.resume()
    }
}
Key points:
URLSessionConfiguration.defaultCreate a default URLSession configuration. -URLSession(configuration:)Create an independent session, which will appear in the session hierarchy of Instruments. -session.sessionDescriptionAdd a name to the session to easily match the timeline with the code object. -session.dataTask(with:)Create aURLSessionTask。task.taskDescriptionAdd a name to the task, and Instruments will use it to label the task interval. -task.resume()Start the request. The lecture explains that the task interval starts here and ends before the completion block is called.
2. Use transaction status to locate HTTP/1 head-of-line blocking
(13:18) The demo App homepage needs to request the image list first, and then concurrently request each thumbnail. The first trace shows that the initial screen takes more than 7 seconds to load. The thumbnail task started later becomes slower and the purple Blocked state becomes longer and longer.
Cut toHTTP Transactions by ConnectionAfter viewing, the problem becomes clear. Each transaction must wait for the previous transaction on the same connection to complete before it can send its own request. This is Head of Line Blocking for HTTP/1. After the server enables HTTP/2, requests can be multiplexed on one connection, and the total time is reduced to less than 3 seconds.
Instruments
→ Profile with Network template
→ HTTP Traffic
→ Select app process
→ Select server domain
→ Track display: HTTP Transactions by Connection
→ Look for: increasing Blocked state on the same connection
→ Check label: HTTP version
Key points:
Network templateContains both Network Connections instrument and HTTP Traffic instrument. -HTTP TrafficTop rails are used to locate traffic peaks. -Select server domainYou can only view requests for a certain backend domain name. -HTTP Transactions by ConnectionTransactions are grouped by connection to determine whether requests are queued on the same connection. -increasing Blocked stateIt is a direct signal to locate the head-of-line blockage in this demonstration. -HTTP versionIt will be displayed on the transaction label to confirm that the request is HTTP/1.1, HTTP/2 or other versions.
3. Use transaction label to check cookie and authentication process
(18:37) When the user collects pictures for the first time, the server returns 401. After the user enters the account password, the URL Loading System retries the transaction and receives 201. Both transactions belong to the same task because it is the same authentication challenge and retry process.
When collecting pictures for the second time, the App asked to log in again. Instruments shows that the request received 401 again and there is no cookie icon on the request label. Looking back at the response of the last successful login, the server did sendSet-Cookie. After expanding the transaction detail, we found that the expiration date of the cookie is March 2020 and has expired, soURLSessionIt will not be sent subsequently.
HTTP/1.1 201 Created
Set-Cookie: session=abc123; Expires=Wed, 18 Mar 2020 12:00:00 GMT; Path=/; Secure; HttpOnly
Content-Type: application/json
Key points:
201 CreatedCorresponds to the status code of successful retry after the first login in the demo. -Set-CookieIndicates that the server attempted to set a login cookie. -Expires=Wed, 18 Mar 2020 12:00:00 GMTis the source of the problem, the speech noted that this date has already passed. -Path=/Limit the path range of cookies. -SecureIndicates that the cookie is only sent over secure connections. -HttpOnlyIndicates that client script cannot read the cookie.- Expired cookies will not be
URLSessionSent, so the next collection request still doesn’t have the Cookie header.
4. Use caching strategy to fix expired list
(24:40) The collection list does not show newly collected images. A task to load the favorites list can be found in Instruments, but it only takes a few milliseconds. Cut toHTTP Transactions by ConnectionLater it was discovered that this transaction was not running on the network connection, it was running onLocal Cachesuperior.
This means that the request was not sent to the server. The repair method in the speech is inURLRequestsettings onreloadRevalidatingCacheData. This way the client will confirm with the server whether the cache is still valid. The server can return 304 to let the client continue to use the local cache; if the data changes, the server returns new data.
import Foundation

func loadFavorites(from endpoint: URL, session: URLSession = .shared) {
    var request = URLRequest(url: endpoint)
    request.cachePolicy = .reloadRevalidatingCacheData

    let task = session.dataTask(with: request) { data, response, error in
        if let error {
            print("favorites failed: \(error)")
            return
        }

        if let httpResponse = response as? HTTPURLResponse {
            print("status: \(httpResponse.statusCode)")
        }

        print("favorites bytes: \(data?.count ?? 0)")
    }

    task.taskDescription = "Reload favorites with cache revalidation"
    task.resume()
}
Key points:
URLRequest(url:)Create a request to load the favorites list. -request.cachePolicyControls how the local cache is used for this request. -.reloadRevalidatingCacheDataIt is the caching strategy used in the speech and will confirm the cache validity to the server. -session.dataTask(with: request)Create a task using request with cache policy. -HTTPURLResponse.statusCodeYou can print the status code returned by the server; the talk mentioned that the server is available 304 means that the cache is still valid. -task.taskDescriptionMake tasks in Instruments easier to identify. -task.resume()Make a request.
5. Use backtrace and HAR to export and audit third-party SDKs
(29:19) The talk ends by examining a third-party login SDK. The App has just entered the login page and has not yet clicked the login button of the SDK. Instruments is already displayed.Pets Sign On Networksession is sending the request. The request is a POST and the backtrace shows that it comes from the SDK and involves a CoreLocation.
After expanding transaction detail, the request body contains location coordinates. The speech made it clear that such behavior would violate user privacy. Developers can save the trace and then usexctraceExport the HTTP Archive (HAR) file and send it to the SDK team to reproduce the problem.
xcrun xctrace export \
  --input ~/Desktop/PrivacyViolation.trace \
  --har \
  --output ~/Desktop/PrivacyViolation.har
Key points:
xcrunCall the command line tools included with Xcode. -xctrace exportExport data from Instruments trace. ---input ~/Desktop/PrivacyViolation.traceSpecify the trace file saved in the lecture. ---harSelect the HTTP Archive format for exchanging HTTP traffic information.- HAR is a JSON-based format that can be inspected using HAR-aware tools, text editors, or scripts.
- Presentation Notes HAR does not contain Instruments proprietary information, e.g.
URLSessionand backtrace, but enough to allow the other party to investigate the HTTP content.
Core Takeaways
1. Add an observable name to the network layer
- What to do: for each business scenario
URLSessionand keyURLSessionTaskSetting description, such as image loading, login, collection synchronization. - Why it’s worth doing: HTTP Traffic Instrument will
sessionDescriptionandtaskDescriptionDisplayed on the timeline, there is no need to guess the business meaning by URL when troubleshooting. - How to start: Initialization in network encapsulation
URLSessionpost settingssession.sessionDescription, set after creating the tasktask.taskDescription, and then use the Network template to record the core process.
2. Create a first-screen network performance inspection process
- What to do: Every time after changing the home page interface or image loading strategy, use Instruments to check whether the first screen request appears in the Blocked state for a long time.
- Why it’s worth doing: The first page in the speech was reduced from more than 7 seconds to less than 3 seconds. The core clue is
HTTP Transactions by ConnectionThe head of the line is blocked. - How to start: Record the trace completed after the App is launched to the first screen, expand HTTP Traffic by domain name, and switch to
HTTP Transactions by Connection, check HTTP version and Blocked status.
3. Write a cookie audit checklist for logged in status
- What to do: Record the link of logging in, retrying, and requesting protected resources again as a trace to confirm whether the server has set a valid cookie and whether subsequent requests include Cookie headers.
- Why it’s worth doing: The bug in the speech is not in the client saving logic, but in the server returning expiration
Set-Cookie. - How to start: View response headers in transaction detail
Set-Cookie, and then check whether the next request label or request headers contains Cookie.
4. Add cache review to the changing list
- What to do: Use the cache review strategy as needed for data that changes, such as favorite lists, notification lists, and collaboration data.
- Why It’s Worth Doing: Favorite List Hits in Speeches
Local Cache, causing users to not see new collections.reloadRevalidatingCacheDataAllows the client to confirm with the server whether the cache has expired. - How to start: Find the correspondence
URLRequest,set uprequest.cachePolicy = .reloadRevalidatingCacheData, and then use Instruments to confirm whether the transaction reaches the connection or receives 304.
5. Automate privacy checks before connecting third-party SDKs
- What to do: After integrating the SDK, record the HTTP traffic before and after the app cold starts, enters the login page, and clicks the SDK button, and checks whether there are unexpected request bodies, location data, or authentication information.
- Why it’s worth doing: HTTP Traffic Instrument can display the session, POST request, headers, body and backtrace created by the SDK itself.
- How to start: Use Network template to record trace, select SDK session, view transactions detail; use
xcrun xctrace export --harExport HAR attached to bug report.
Related Sessions
- Accelerate networking with HTTP/3 and QUIC — Explains HTTP/2 multiplexing and HTTP/3/QUIC, which can supplement the protocol background of this field on head-of-line blocking.
- Use async/await with URLSession — Shows how URLSession is written under Swift Concurrency, suitable for viewing together with the URLSession diagnostic method in this field.
- Symbolication: Beyond the basics — Explain how symbolization allows Instruments’ backtrace to correspond back to the source code.
- Optimize for 5G networks — Discusses data transmission optimization under mobile networks, adjacent to the HTTP traffic audit goal of this field.
Comments
GitHub Issues · utterances