
Highlight
Xcode 13 integrates TestFlight crash rapid delivery, tester feedback, distribution maps, crash sharing, Terminations Organizer and MetricKit faster diagnostic delivery into the developer troubleshooting process to help the team locate online and beta version crashes faster.
Core Content
A common crash troubleshooting process is convoluted.
A tester encountered a crash in TestFlight and wrote a piece of feedback. Developers need to go to App Store Connect to read feedback, download the crash log, and then return to Xcode to analyze the call stack. If the problem only occurs on a specific network, device or version, a crash log alone is often not enough.
Xcode 13 changed this link. After a TestFlight build crashes, Organizer receives the crash a few moments later. Crashes Organizer also puts the latest day’s TestFlight crashes, hourly charts, one-year history, version and product filters in one interface.
This changes the investigation from “collecting materials first” to “looking directly at the context”. You can first filter to App Clip, watch app or extension, and then see how many devices it affects, which version it started appearing from, and whether it has entered the App Store version.
TestFlight feedback goes into Xcode
In the past, tester text feedback and crash call stacks were scattered in different places. Xcode 13 adds a new Feedback Inspector that puts tester feedback that hits the same crash next to the crash report.
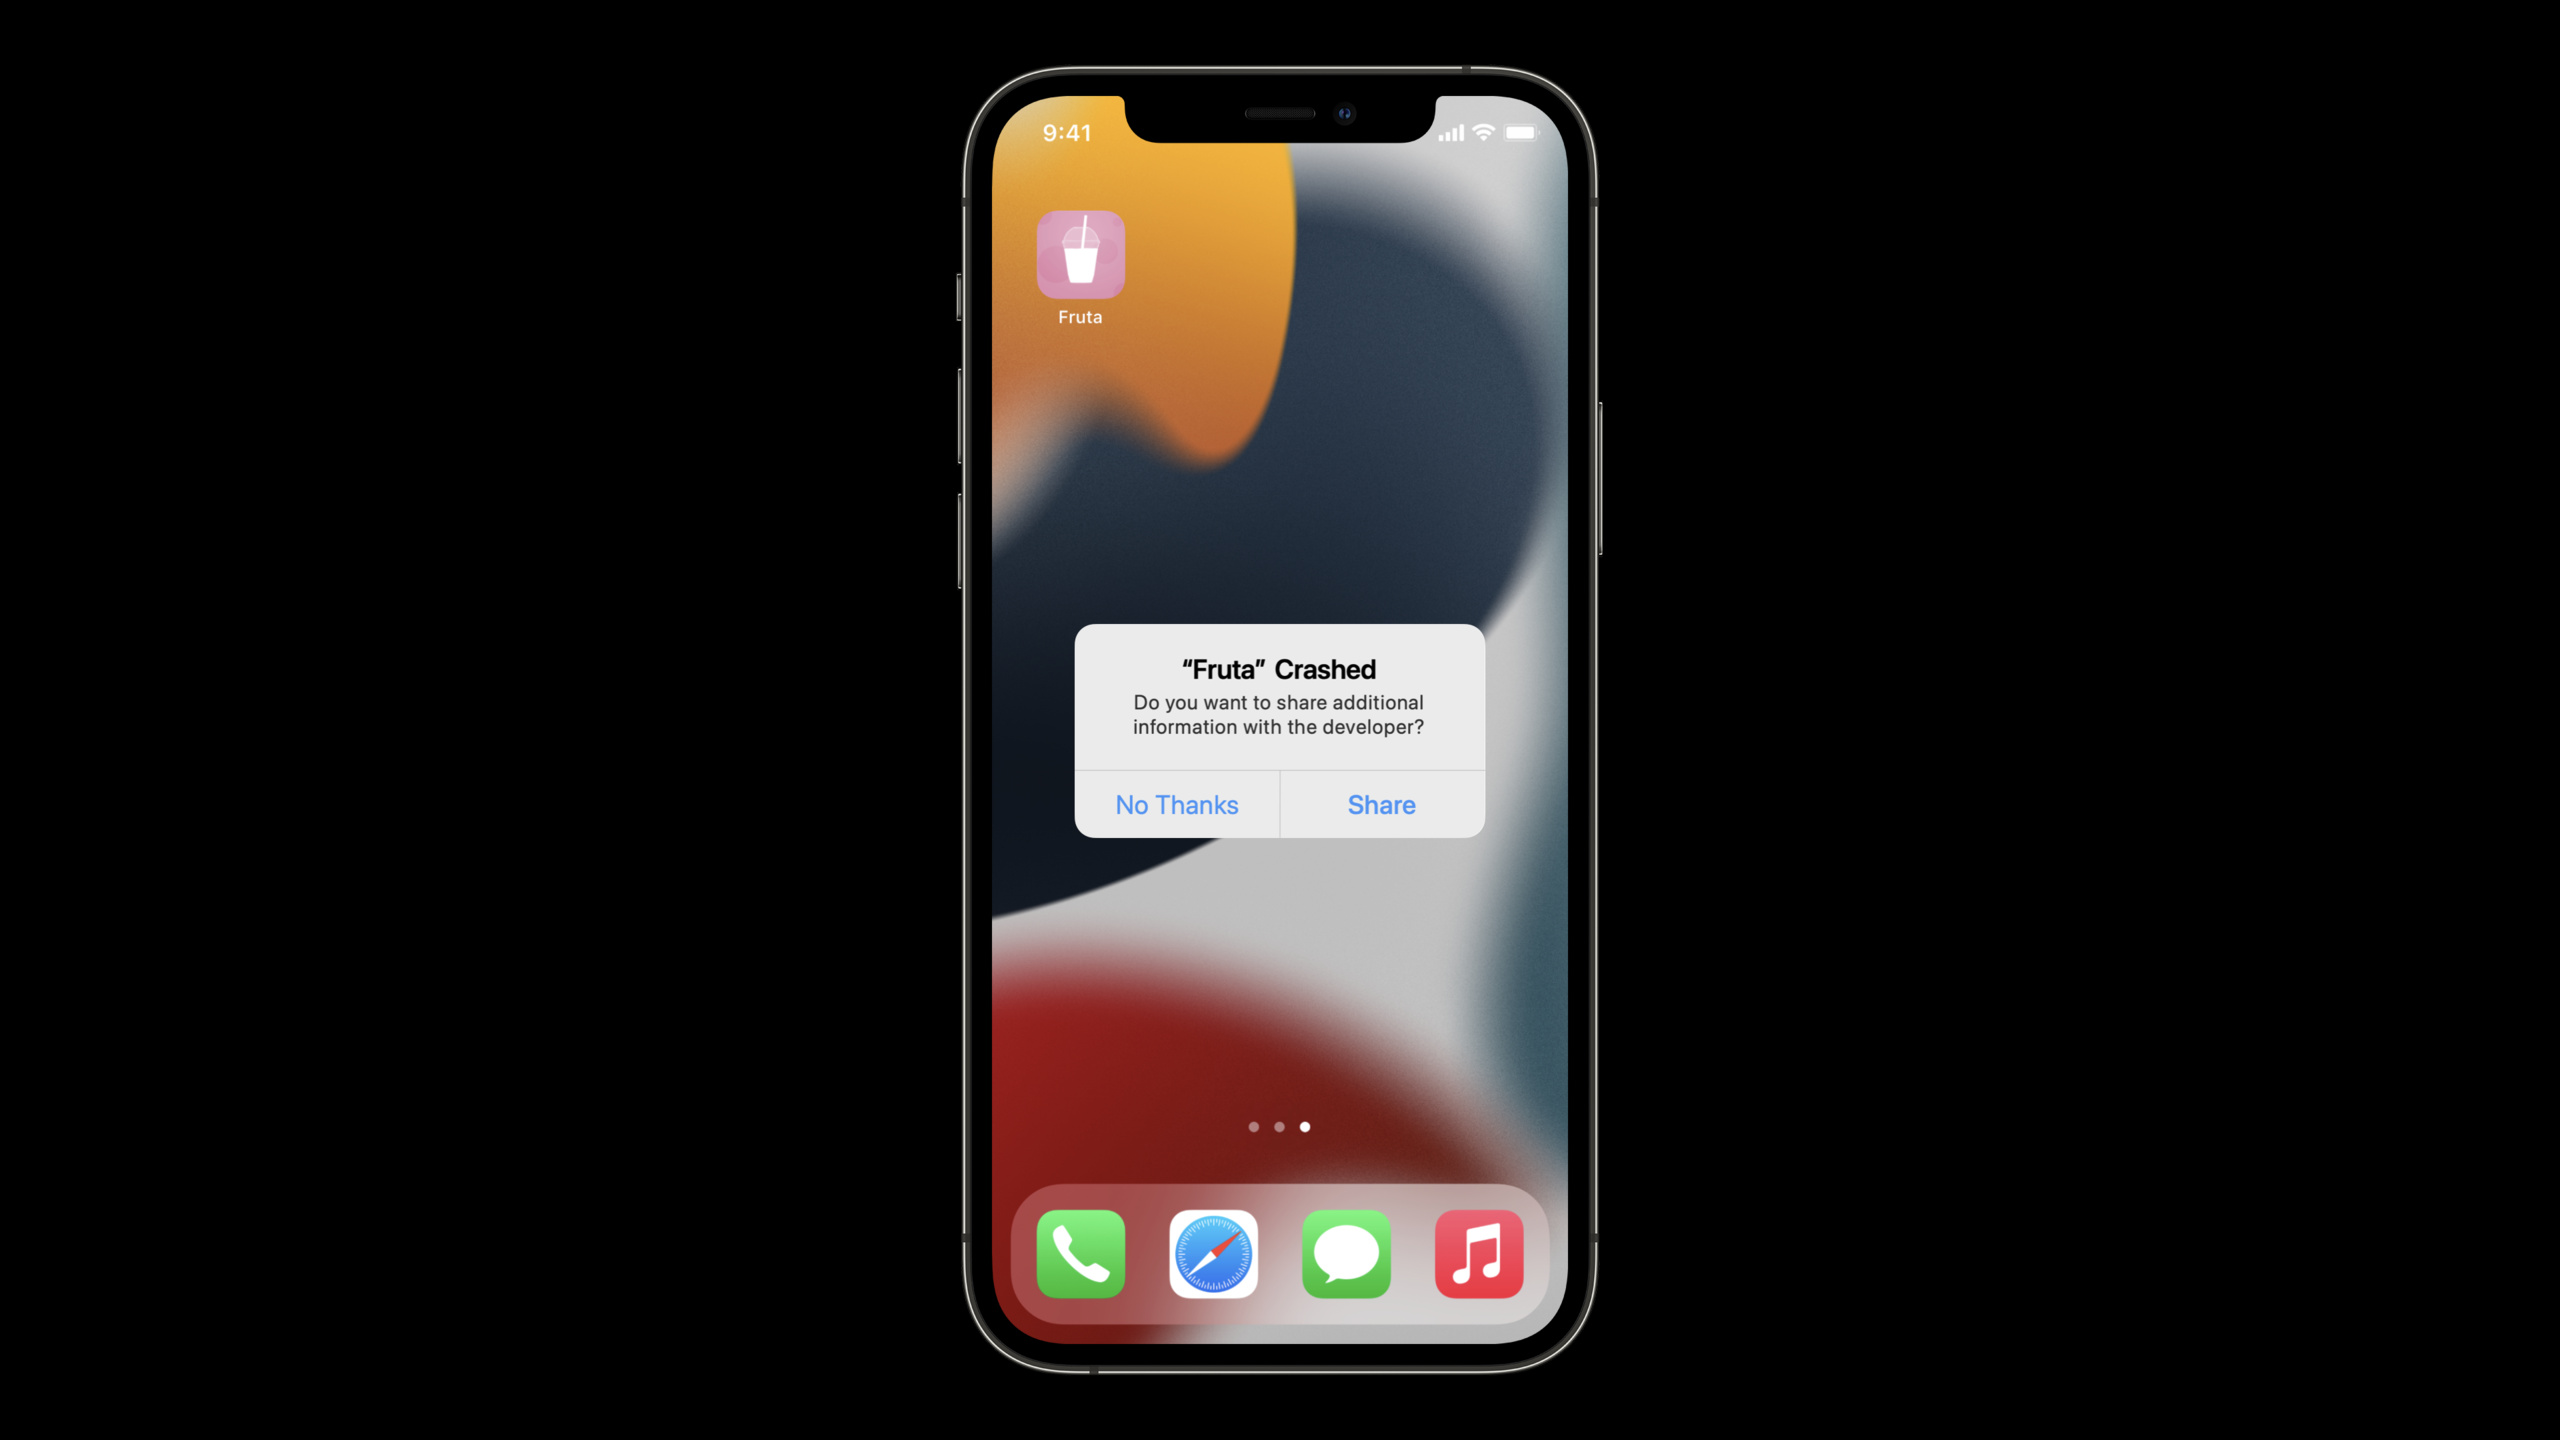
The Fruta examples in Session are very specific. A developer sees an App Clip crash, and the call stack shows that it occurs in the favorites synchronization logic on a background thread. It’s hard to know the triggering conditions just by looking at the code. Feedback Inspector shows that the tester was in a tunnel, using a cellular network, and crashed seconds after pressing the favorite button.
When these clues are put together, the problem becomes clear: poor network quality causes the backend synchronization to take more than 10 seconds, and the code usesfatalErrorActive collapse. The fix direction also becomes handling timeouts, so developers don’t have to continue guessing about the steps to reproduce.
Crash can be shared directly with the team
Another common annoyance when working as a team is the “look at this crash”. The other party gives a screenshot or a description, and the recipient has to search for it in Organizer.
Xcode 13 adds a Share button to Crashes Organizer. The shared link can point to a specific crash. When the recipient clicks the link, Organizer downloads and focuses on that crash without the need for refiltering.
Terminations Organizer adds another type of exit
Crashes Organizer focuses on crashes caused by programming errors. There are other types of application process exits: startup timeout, system memory limit reached, background terminated by the system.
Xcode 13 adds a new Terminations Organizer that displays termination trends by reason and supports comparison with older versions. It helps developers determine whether a certain type of termination is a regression introduced in a new version, and can also distinguish whether the termination occurs in the background or the application foreground.
MetricKit delivers crash diagnosis faster
MetricKit (metrics framework) can receive diagnostic data in application code. In Xcode 13, crash diagnostics are no longer aggregated and delivered once a day, but are delivered the next time the application is started. MetricKit also supports macOS.
This is suitable for making your own crash backend. You can register as a subscriber after the app is launched and receiveMXDiagnosticPayloadread latercrashDiagnostics, and then connect the diagnostic data to the existing analysis system.
Detailed Content
TestFlight crash fast delivery and filtering
(02:17) Xcode 13 will send the crash to the Organizer moments after the TestFlight build crashes. Crashes Organizer can view the most recent day’s TestFlight crashes and display an hourly graph showing the time distribution of selected crashes.
Session also mentioned that one year of crash history is now available. Developers can filter by time range to view crashes that have occurred within the past year. The graph in the inspector shows the prevalence of crashes by month.
Key entrance:
Window → Organizer → Crashes
Filter: Time Period → Last Day / Last Two Weeks / Last Year
Filter: Versions and Builds → All Versions and Builds / Individual Release
Filter: Products → iOS App / App Clip / watch app / app extensions
Distribution: Versions / TestFlight / App Store
Key points:
Window → Organizer → CrashesOpen Xcode’s Crashes Organizer. -Time PeriodUsed to narrow the time range, the Session displays the history of the last day, the last two weeks, and the year. -Versions and BuildsUsed to determine which version the crash started to appear from, or whether it only affects a certain build. -ProductsUsed to filter App Clip, watch app, extension and other products released with the application. -DistributionUsed to view the distribution of the same crash between versions, TestFlight and App Store.
(06:13) The Fruta app in the demo first opens Organizer, and then uses the product filter to select App Clip. Crashes in the list display a badge indicating that they came from an App Clip, watch app, or extension. This allows developers to first identify affected application areas.
Key entrance:
Crashes Organizer
  Products Filter → App Clip
  Crashes List → Top Crash
  Inspector Graph → First appeared in version 2.0
  Release Filter → TestFlight and App Store
Key points:
Products Filter → App ClipShows only App Clip crashes. -Top CrashShows the number of devices affected in the last two weeks and the last day. -Inspector GraphDisplays the earliest version of the crash. -Release FilterHelp confirm whether the issue has affected App Store users.
Feedback Inspector places recurrence clues next to the crash
(04:44) Xcode 13 brings TestFlight Crash Feedback to Crashes Organizer. Developers can still download raw feedback and crash logs in App Store Connect, or open associated crashes directly with the new Open in Xcode button.
Key entrance:
App Store Connect → TestFlight Feedback → Open in Xcode
Xcode Organizer → Crashes → Feedback Inspector
Feedback Report → version, build, device model, battery level, available disk space, tester comment
Key points:
Open in XcodeLink crashes when jumping from App Store Connect to Organizer. -Feedback InspectorDisplays feedback from all testers that hit the selected crash. -versionandbuildIndicate the specific version installed by the tester. -device model、battery level、available disk spaceProvides device status. -tester commentIt is the direct source of the recurrence condition. The key clues in the Session example are tunnel, cellular network and favorite button.
(09:24) In the Fruta example, feedback reports show testers tunneling under a cellular network. Combined with the background synchronization logic in the call stack, the developer concluded that poor network quality would cause the backend synchronization to exceed 10 seconds, triggering a crash in the code.
Key troubleshooting paths:
Feedback: "I was going through a tunnel and I hit the favorite button. A few seconds later, it crashed."
Backtrace: background thread, syncing favorites
Code path: save favorite to disk → update backend → wait with 10-second timeout → fatal error
Fix direction: increase timeout and call completion handler on timeout
Key points:
- Tester feedback gave two environmental conditions: “tunnel” and “cellular network”.
- backtrace shows that the crash occurred on a background thread, in sync with favorites.
- Code path includes disk save, backend update and dispatch group wait.
- A 10-second timeout triggers a crash. The fix is to treat the timeout as a handleable result.
Open in Project and Share shorten team collaboration
(10:19) When developers are ready to fix a crash, they can use the Open in Project button to open the project. Xcode will display the backtrace in the Debug Navigator and highlight the crashing code line in the editor.
Key entrance:
Crashes Organizer → Selected Crash → Open in Project
Xcode Project → Debug Navigator → Backtrace
Editor → Highlighted crashing line
Key points:
Open in ProjectEnter the corresponding Xcode project from Organizer. -Debug NavigatorShow crash backtrace.- The editor directly highlights the crash line, reducing the steps of manually locating files and line numbers.
(04:01) Xcode 13 can also share crash reports directly from Organizer. The Share button in the toolbar can send the crash link to team members or add it to the to-do list.
Key entrance:
Crashes Organizer → Toolbar → Share
Shared Link → Organizer downloads and focuses on the issue
Resolved Crash → Friendly Name
Key points:
ShareGenerate links to specific crashes.- Organizer focuses on the crash after a team member opens the link.
- Resolved crashes can be marked resolved and given a more easily identifiable name.
Terminations Organizer Focus on non-crash exit
(12:59) Terminations Organizer displays app termination trends. Session clearly distinguishes between crashes and terminations: the former comes from programming failures, and the latter may come from startup timeouts, system memory limitations, etc.
Key entrance:
Xcode Organizer → Terminations
Termination Categories:
  - Timing out on launch
  - Hitting the system memory limit
Compare: current version vs previous versions
Context: background vs onscreen
Key points:
Terminationsis a new view in Organizer. -Timing out on launchIndicates that the application startup time exceeds the allowed range of the system. -Hitting the system memory limitIndicates that the process has reached the system memory limit. -CompareUsed to find termination regressions of new versions relative to older versions. -background vs onscreenHelps determine the direct impact of termination on user experience.
MetricKit will deliver crash diagnostics at the next startup
(13:56) MetricKit can collect crash logs in application code. The change in Xcode 13 is that crash diagnostics are no longer aggregated and delivered once a day, but are delivered the next time the application is started. Session also announced MetricKit support for macOS.
The official code snippet is as follows.
//  Capture crash logs in your code

import MetricKit

class Subscriber: NSObject {
    override init() {
        super.init()
        MXMetricManager.shared.add(self)
    }

    deinit {
        MXMetricManager.shared.remove(self)
    }
}

extension Subscriber: MXMetricManagerSubscriber {
    func didReceive(_ payloads: [MXDiagnosticPayload]) {
        payloads.forEach {
            if let crashDiagnostics = $0.crashDiagnostics {
                // Begin analyzing crash diagnostic payload.
            }
        }
    }
}
Key points:
import MetricKitIntroducing the MetricKit framework. -Subscriber: NSObjectDefines an Objective-C runtime-compatible subscription object. -override init()Subscribers are registered when the object is created. -MXMetricManager.shared.add(self)Start listening for MetricKit payload. -deinitUnsubscribe when the object is released. -MXMetricManager.shared.remove(self)Prevents the subscriber from continuing to receive callbacks. -MXMetricManagerSubscriberIs the protocol for receiving MetricKit payload. -didReceive(_ payloads: [MXDiagnosticPayload])Called when the diagnostic payload arrives. -payloads.forEachTraverse all diagnostic payloads received this time. -$0.crashDiagnosticsRead the crash diagnostics; enter the analysis process when there is a value.
Core Takeaways
1. Create a daily troubleshooting queue for TestFlight crashes
- What to do: Open the Crashes Organizer every day, only view the TestFlight crashes of the last day, and sort them by the number of devices affected.
- Why it’s worth it: Xcode 13 will be delivered moments after TestFlight crashes, and the last day view and hourly chart can help you quickly confirm whether new builds introduce problems.
- How to start: From
Window → Organizer → CrashesEnter, setTime Period → Last Day, and then use version and product filters to target the current test build.
2. Check stability separately for App Clip, watch app and extension
- What to do: Filter and view the crashes of the main app, App Clip, watch app, and share extension respectively.
- Why it’s worth doing: The crashes list in the Session will use badges to mark the sources of crashes, and the product filter can directly focus on a product released with the application.
- How to start: Open in Crashes Organizer
Products Filter, select App Clip, watch app or target extension to record the top crash of each product.
3. Use tester feedback as a source of replication steps
- WHAT TO DO: Read tester comments and device status in Feedback Inspector before fixing TestFlight crashes.
- Why it’s worth doing: The Fruta example proves that a tester’s words can explain the environmental conditions behind the call stack, such as weak network, device status and user actions.
- How to start: Look for the feedback icon in the crash list and open it
Feedback Inspector, focusing on version, build, device model, battery capacity, available disk space, and reviews.
4. Use shared links to reduce team troubleshooting costs
- What to do: When you encounter a crash that needs to be addressed by a colleague, share the crash link directly from the Organizer.
- Why it’s worth doing: After the recipient opens the link, Organizer will download and focus on the same crash, avoiding ambiguity caused by screenshots and verbal descriptions.
- How to start: Select crash report and click on the toolbar
Share, send the link to the colleague responsible for the module or put it into the task system.
5. Access MetricKit crash diagnostics in the application
- What: Create MetricKit subscribers in the application startup path, collect
crashDiagnosticsThen access your own diagnostic background. - Why it’s worth doing: Xcode 13 allows crash diagnostics to be delivered at the next startup, which is more suitable for quickly locating crashes than aggregating once a day.
- How to start: Introduction
MetricKit, create an implementationMXMetricManagerSubscriberobject, useMXMetricManager.shared.add(self)Register atdidReceive(_:)read inMXDiagnosticPayload.crashDiagnostics。
Related Sessions
- Ultimate application performance survival guide — Explains the indicators, tools and usage of MetricKit for performance optimization.
- Detect and diagnose memory issues — Focuses on troubleshooting memory issues, related to system memory limit scenarios in Terminations Organizer.
- Understand and eliminate hangs from your app — Explains stuck and delay troubleshooting, and supplements the application stability diagnosis tool chain.
- Diagnose unreliable code with test repetitions — Use repeated tests to reproduce unstable code, crashes, and flaky behavior.
- Meet TestFlight on Mac — Introducing TestFlight on Mac, feedback collection, and test distribution process.
Comments
GitHub Issues · utterances