
Highlight
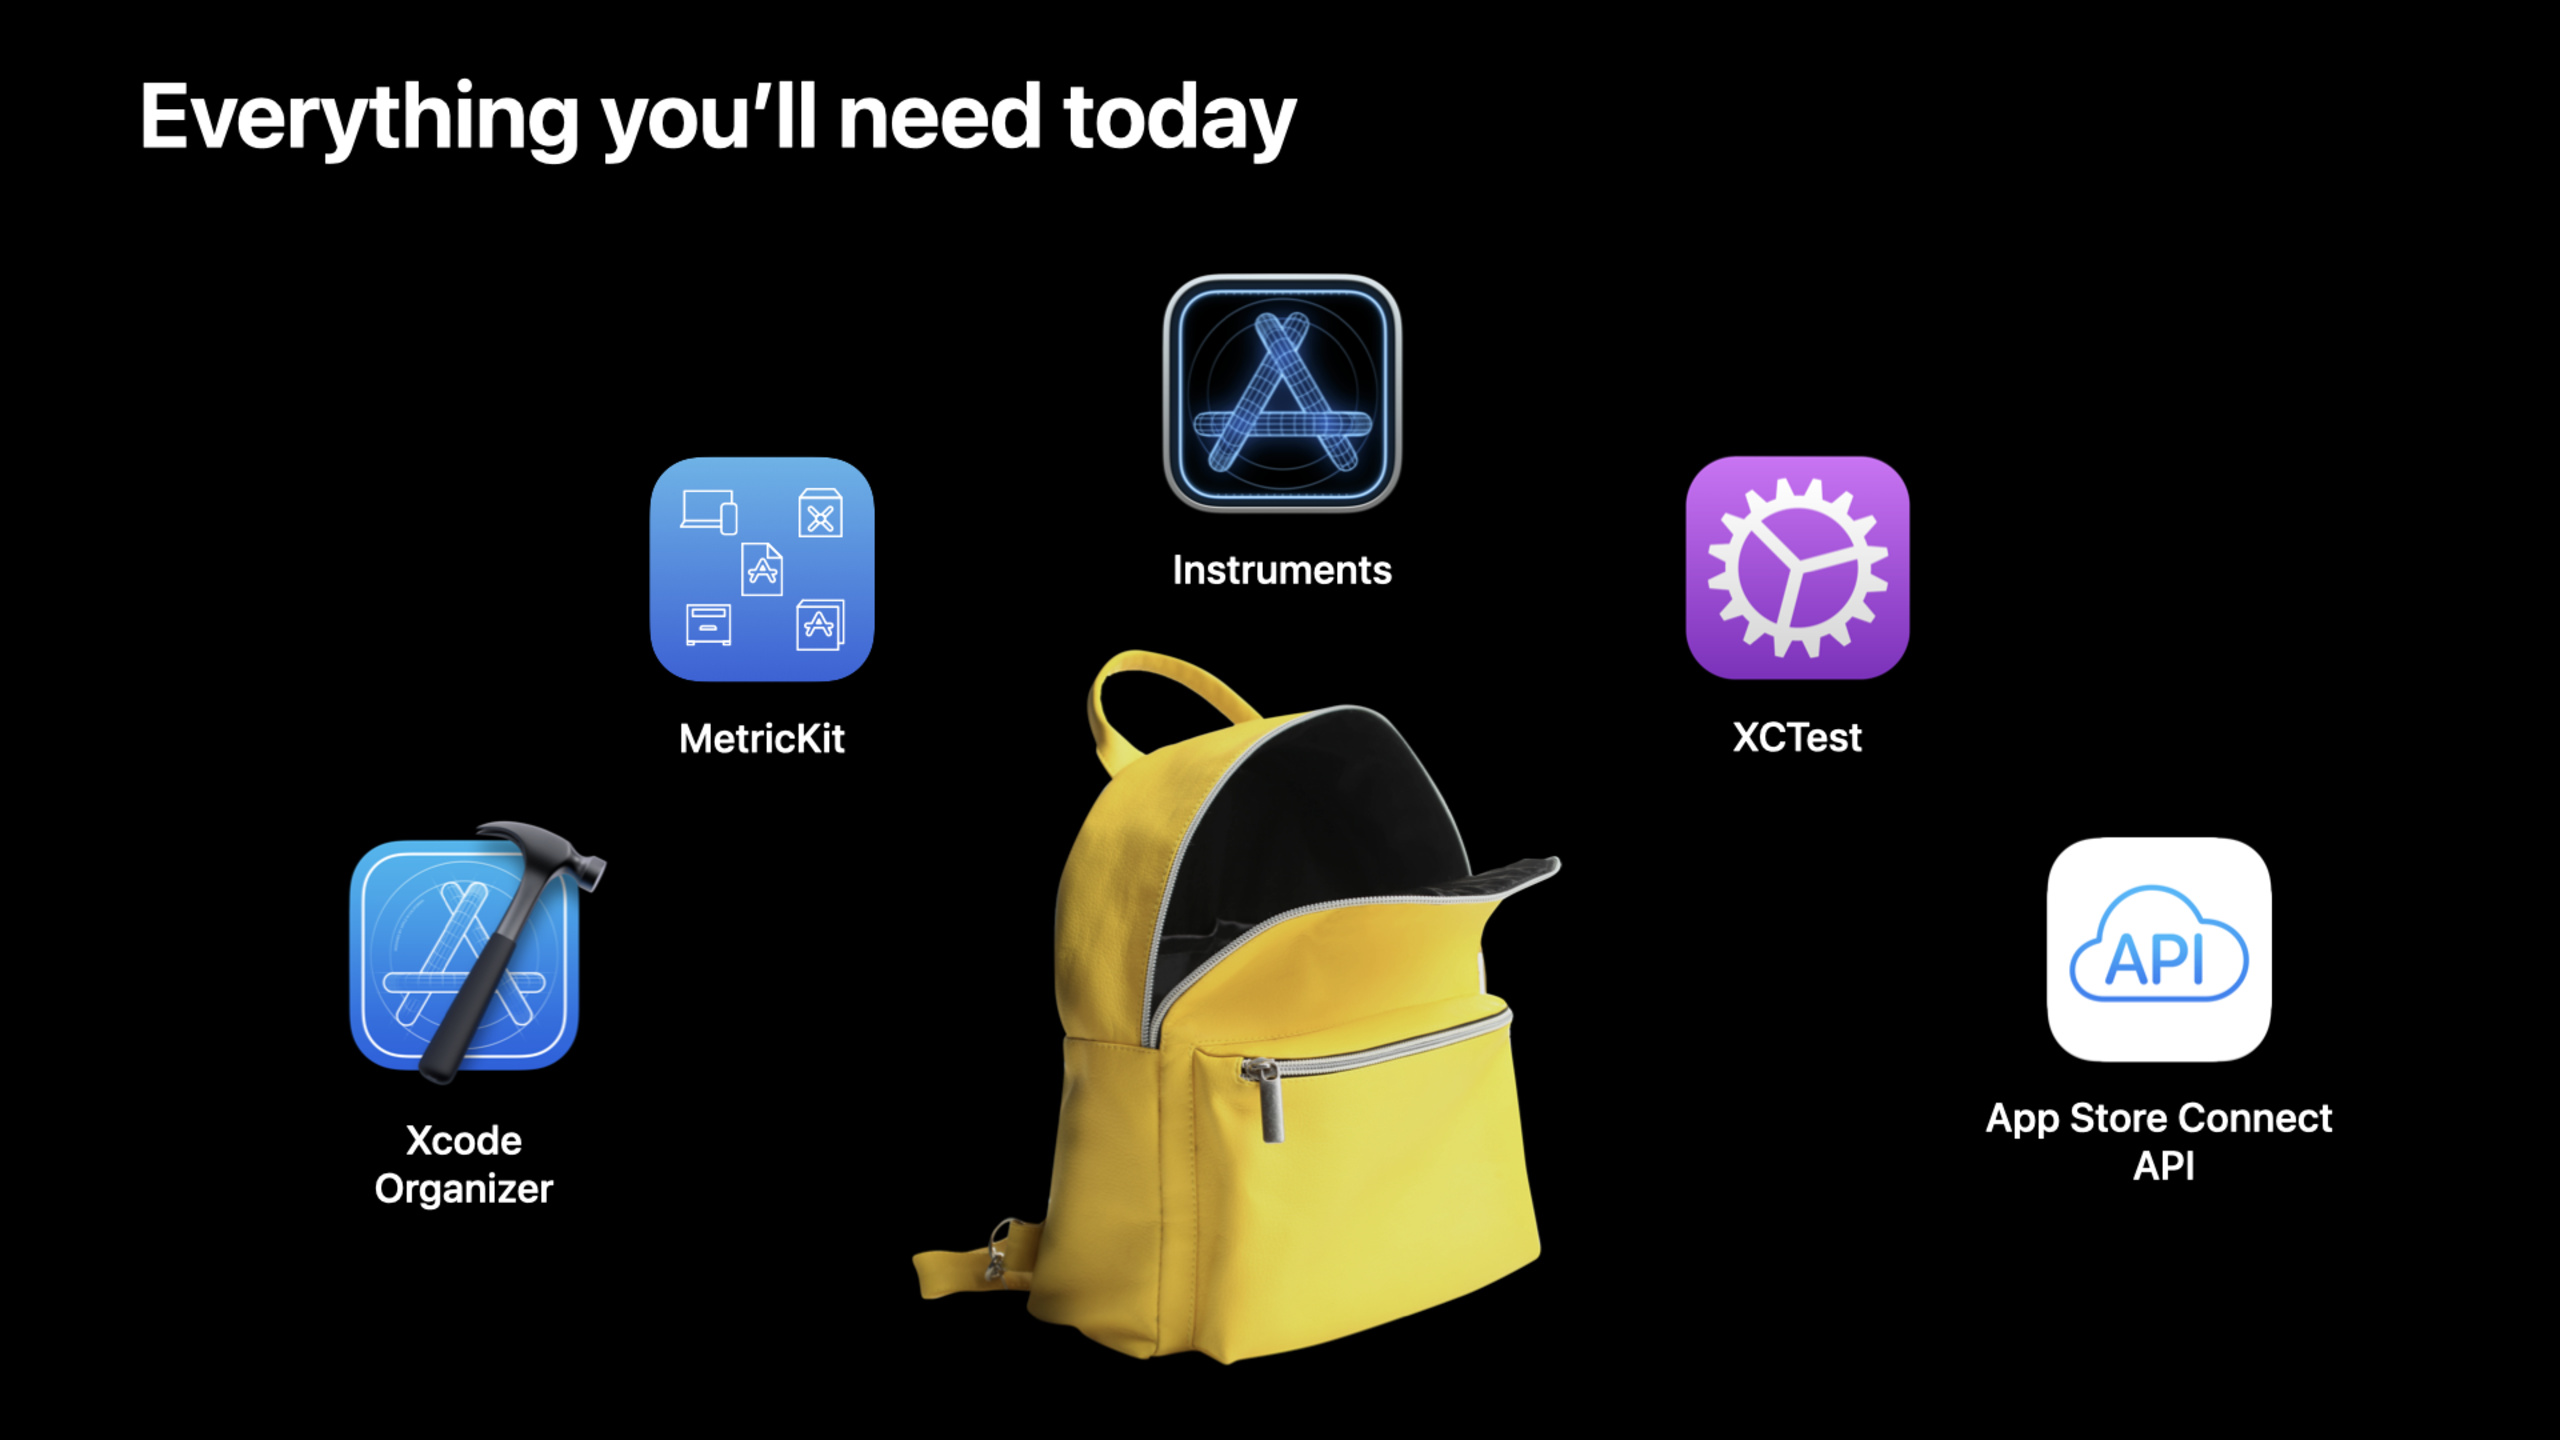
Apple uses Xcode Organizer, MetricKit, Instruments, XCTest and App Store Connect API to connect performance indicators such as battery, startup, freeze, memory, disk writing, scrolling and termination rates, allowing developers to continuously discover performance regressions after development, testing and online release.
Core Content
Performance problems first appear in the hands of users
After MealPlanner added the ability to save recipes and pictures, problems began to arise. The scrolling of the list will be jittery, the first frame will not appear for a long time at startup, and too many files may be written to save data once. Developers may not be able to reproduce it on the desktop, but users have encountered these problems on real devices.
In the past, a common approach to dealing with this type of problem was to wait for user feedback and then try to guess the cause. There are tools for battery, startup, lag, memory, and disk writing. The data is scattered and the troubleshooting path is very long. After a new version is launched, if a certain indicator becomes worse, developers need to first know where it has become worse, and then find the corresponding code.
Apple provides a complete path in this session. Use Xcode Debug navigator and Instruments to observe the scene during development; use XCTest to write performance tests during testing; and use Xcode Organizer, MetricKit and App Store Connect API online to read aggregated data on real devices.
This path solves the same pain point: performance optimization cannot just rely on feeling. Every question must have an indicator, and each indicator must be able to return to a user action or a piece of code.
Eight indicators correspond to five sets of tools
The speech first lists eight core indicators: Battery Usage, Launch Time, Hang Rate, Memory, Disk Writes, Scrolling, Terminations and MXSignposts (01:54). These indicators cover the most easily perceived experiences for users: power consumption, slow startup, unresponsive interface, stuck scrolling, and being killed by the system.
Tools are also layered. Xcode Organizer looks at online version trends, MetricKit collects device-side telemetry, Instruments locates the call stack on the development machine, XCTest writes performance requirements into tests, and the App Store Connect API allows teams to connect the same data to their own analysis systems.
Detailed Content
Use MetricKit to collect online telemetry
(05:46) MetricKit is a device-side performance telemetry framework. App only requires registrationMXMetricManagerSubscriber, to receive daily metrics and diagnostic payload. The speech mentioned that data such as battery logs and CPU indicators can be combined with the app’s own context to narrow down the root cause of online problems.
import MetricKit

class AppMetrics: MXMetricManagerSubscriber {
    init() {
        let shared = MXMetricManager.shared
        shared.add(self)
    }

    deinit {
        let shared = MXMetricManager.shared
        shared.remove(self)
    }

    // Receive daily metrics
    func didReceive(_ payloads: [MXMetricPayload]) {
        // Process metrics
    }

    // Receive diagnostics
    func didReceive(_ payloads: [MXDiagnosticPayload]) {
        // Process metrics
    }
}
Key points:
import MetricKitIntroducing MetricKit API. -AppMetricsobeyMXMetricManagerSubscriber, indicating that this object can receive performance data. -MXMetricManager.sharedGet the global metric manager. -shared.add(self)Register subscribers on initialization. -shared.remove(self)Removing subscribers on release is a recommended practice in the talk. -didReceive(_ payloads: [MXMetricPayload])Receive daily metrics payload. -didReceive(_ payloads: [MXDiagnosticPayload])Receive diagnostic payload.
(07:00) The same batch of online data will also enter Xcode Organizer. Developers can view battery usage trends for the last 16 app versions, and see significantly increased metrics for the latest version in the Regression pane added in Xcode 13.
Use XCTest to measure scrolling lag
(10:29) The scrolling lag comes from a specific fact: new content is not ready before the next screen refresh. What the user sees is the list skipping frames, jittering, and freezing. for speechXCTOSSignpostMetric.scrollDecelerationMetricWrote a rolling performance test to prevent the release of stuck versions.
func testScrollingAnimationPerformance() throws {

    app.launch()
    app.staticTexts["Meal Planner"].tap()
    let foodCollection = app.collectionViews.firstMatch

    let measureOptions = XCTMeasureOptions()
    measureOptions.invocationOptions = [.manuallyStop]

    measure(metrics: [XCTOSSignpostMetric.scrollDecelerationMetric],
    options: measureOptions) {
        foodCollection.swipeUp(velocity: .fast)
        stopMeasuring()
        foodCollection.swipeDown(velocity: .fast)
    }
}
Key points:
app.launch()Start the UI test target app. -app.staticTexts["Meal Planner"].tap()Go to the Meal Planner page. -app.collectionViews.firstMatchFind the first collection view as the scroll object. -XCTMeasureOptions()Create measurement options. -.manuallyStopLet the test stop the measurement manually to exclude the action of resetting the status. -XCTOSSignpostMetric.scrollDecelerationMetricSpecifies the measurement roll deceleration phase. -foodCollection.swipeUp(velocity: .fast)Perform a quick slide up, which is the action being tested. -stopMeasuring()Stop measuring. -foodCollection.swipeDown(velocity: .fast)Scroll the interface back to restore the state for the next measurement.
(11:25) In iOS 15 and macOS 12, MetricKit delivers diagnostics, including hang diagnostics, immediately after a problem occurs. Online issues do not need to wait for the next day’s daily payload, and developers can get on-site data faster.
Custom animation with MXSignpost tag
(11:53) In addition to scrolling, there are also custom animations in the App. iOS 15 in MetricKitMXSignpostRelated APIs are used to manage key code intervals.mxSignpostAnimationIntervalBeginMark animation start,mxSignpostof.endAfter marking the end, MetricKit will collect the hitch-rate telemetry in this interval.
import MetricKit

func startAnimating() {
    // Mark the beginning of animations
    mxSignpostAnimationIntervalBegin(
        log: MXMetricManager.makeLogHandle(category: "animation_telemetry"),
        name: "custom_animation")
}

func animationDidComplete() {
    // Mark the end of the animation to receive the collected hitch rate telemetry
    mxSignpost(OSSignpostType.end,
        log: MXMetricManager.makeLogHandle(category: "animation_telemetry"),
        name: "custom_animation")
}
Key points:
MXMetricManager.makeLogHandle(category:)Create a log handle used by MetricKit. -category: "animation_telemetry"Group animation telemetry to facilitate subsequent analysis. -mxSignpostAnimationIntervalBeginMarks the start of the animation interval. -name: "custom_animation"Give this animation a name. -animationDidComplete()Called when the animation is complete. -mxSignpost(OSSignpostType.end, ...)Marks the end of the animation interval with the same name.- Start and end with the same group
logandname, MetricKit can match the intervals.
Measuring disk writes with XCTest
(13:51) Frequent disk writes can slow down operations and affect device NAND health. The lecture suggested that you first use the File Activity template of Instruments to view the file system calls, and then useXCTStorageMetricWrite the critical path as a performance test.
// Example performance XCTest

func testSaveMeal() {
    let app = XCUIApplication()
    let options = XCTMeasureOptions()
    options.invocationOptions = [.manuallyStart]

    measure(metrics: [XCTStorageMetric(application: app)], options: options) {
        app.launch()
        startMeasuring()

        let firstCell = app.cells.firstMatch
        firstCell.buttons["Save meal"].firstMatch.tap()

        let savedButton = firstCell.buttons["Saved"].firstMatch
        XCTAssertTrue(savedButton.waitForExistence(timeout: 2))
    }
}
Key points:
XCUIApplication()Create the App object in the UI test. -XCTMeasureOptions()Create a measurement configuration. -.manuallyStartLet the test start measuring after the app is launched. -XCTStorageMetric(application: app)Specifies to measure disk writes for this app. -measure(metrics:options:)Wrap the user action to be measured. -app.launch()Start the app, but the measurement has not started yet. -startMeasuring()Disk writes are recorded starting before the save action. -firstCell.buttons["Save meal"].firstMatch.tap()Simulate a user saving a meal. -XCTAssertTrue(savedButton.waitForExistence(timeout: 2))Confirm that the save is complete.
(14:16) This test can set baseline. The test fails when the expected write volume is exceeded. After the online version has been released, Organizer’s Disk Writes metric can show the trend of the current version relative to older versions. Writes exceeding 1 GB/24 hours also generate Disk Writes Reports with stack trace.
Use toolchain to track startup, termination and memory
(19:00) Launch time refers to the time between the user clicking the icon and the App rendering the first frame. The App Launch template will run the App for five seconds and collect time profile and Thread State Trace to help developers see why threads are blocked during startup.
func testLaunchPerformance() throws {
    let app = XCUIApplication()

    measure(metrics: [XCTApplicationLaunchMetric()]) {
        app.launch()
    }
}
Key points:
XCUIApplication()Create the app under test. -measure(metrics:)Create performance measurement blocks. -XCTApplicationLaunchMetric()Specifies measured startup performance. -app.launch()It is the action under test, corresponding to the startup process after the user clicks on the icon.
(21:19) Memory is a resource shared by App, system and kernel. If the app exceeds the memory limit, it will be terminated by the system. The next time the user opens it, he can only go through the complete startup process. The speech suggested using Instruments’ Leaks, Allocations, and VM Tracker templates to analyze memory. You can also use MXSignpost to wrap key code segments and collect more detailed memory telemetry.
import MetricKit

// Collect memory telemetry

func saveAppAssets() {
    mxSignpost(OSSignpostType.begin,
        log: MXMetricManager.makeLogHandle(category: "memory_telemetry"),
        name: "custom_memory")

    // save app metadata

    mxSignpost(OSSignpostType.end,
        log: MXMetricManager.makeLogHandle(category: "memory_telemetry"),
        name: "custom_memory")
}
Key points:
mxSignpost(OSSignpostType.begin, ...)Mark the beginning of the critical code section. -category: "memory_telemetry"Put this telemetry into the memory analysis category. -name: "custom_memory"Give the interval a name. -// save app metadataRepresents the resource saving logic that actually needs to be observed. -mxSignpost(OSSignpostType.end, ...)Marks the end of the interval.- Use the same category and name for begin and end to facilitate MetricKit to summarize the memory data of this section.
Core Takeaways
-
What to do: Make a performance health page for the app, showing only the battery, startup, lag, and disk write trends of the most recent version. Why it’s worth doing: Xcode Organizer and App Store Connect API already provide online aggregated data, so teams can turn performance regressions into daily visible metrics. How to start: First manually check Battery Usage, Launch Time, Hang Rate and Disk Writes in Organizer, and then use the App Store Connect API to pull similar JSON data into the internal dashboard.
-
What to do: Write a scrolling performance test for the homepage list. Why it’s worth doing: Scrolling lag directly affects the user’s dwell time.
XCTOSSignpostMetric.scrollDecelerationMetricYou can prevent the risk of lag before release. How to start: Use UI Test to open the list page, inmeasure(metrics:)executed inswipeUp(velocity:),useXCTMeasureOptionsExclude steps to reset state. -
What to do: Add disk writing tests for heavy I/O operations such as image import, cache refresh, and batch saving. Why it’s worth doing: The talk points out that frequent disk writes can slow down the experience, and Organizer also generates a report when more than 1 GB is written in a 24-hour period. How to start: Use
XCTStorageMetric(application:)Wrap a typical save action, set a baseline, and let code that exceeds the expected amount of writes fail during the testing phase. -
What to do: Add MXSignpost to the custom animation and asset save path. Why it’s worth doing: MetricKit can collect hit rate and memory telemetry around custom intervals, and online questions can be mapped to business actions. How to start: Use
MXMetricManager.makeLogHandle(category:)Create categories and call them at the beginning and end of the critical pathmxSignpostAnimationIntervalBeginormxSignpost。 -
What to do: Establish a performance baseline for the startup process. Why it’s worth doing: Slow startup may cause the system to terminate, and the user will have to go through the entire startup process again the next time it is opened. How to get started: Use with XCTest
XCTApplicationLaunchMetric()Measure the startup, and then use the App Launch template of Instruments to view the time profile and Thread State Trace of the five seconds before startup.
Related Sessions
- Detect and diagnose memory issues — Continue to expand memory metrics, memgraph collection, and XCTest memory regression testing.
- Understand and eliminate hangs from your app — In-depth explanation of the causes of hangs, and methods of using asynchronous code and GCD to eliminate hangs.
- Analyze HTTP traffic in Instruments — Use the Instruments Network template to view network behavior for URLSession, tasks, and HTTP requests.
- Embrace Expected Failures in XCTest — Manage known failures in tests to make performance and functional tests more suitable for long-term maintenance.
Comments
GitHub Issues · utterances