
Highlight
Xcode 13’s Metal Debugger adds Acceleration Structure Viewer, GPU Timeline, shader validation and texture converter, covering the entire process of light tracing debugging, performance analysis and resource creation.
Core Content
Your Metal app is having rendering issues. There are artifacts in the picture, or the frame rate suddenly drops in some scenes. You need tools to pinpoint the problem: is the shader at fault? Is there a problem with resource binding? Or is it a GPU performance bottleneck?
Xcode 13’s Metal Debugger has major updates this year, covering ray tracing, profiling, and texturing.
Detailed Content
Acceleration Structure Viewer
(01:25)
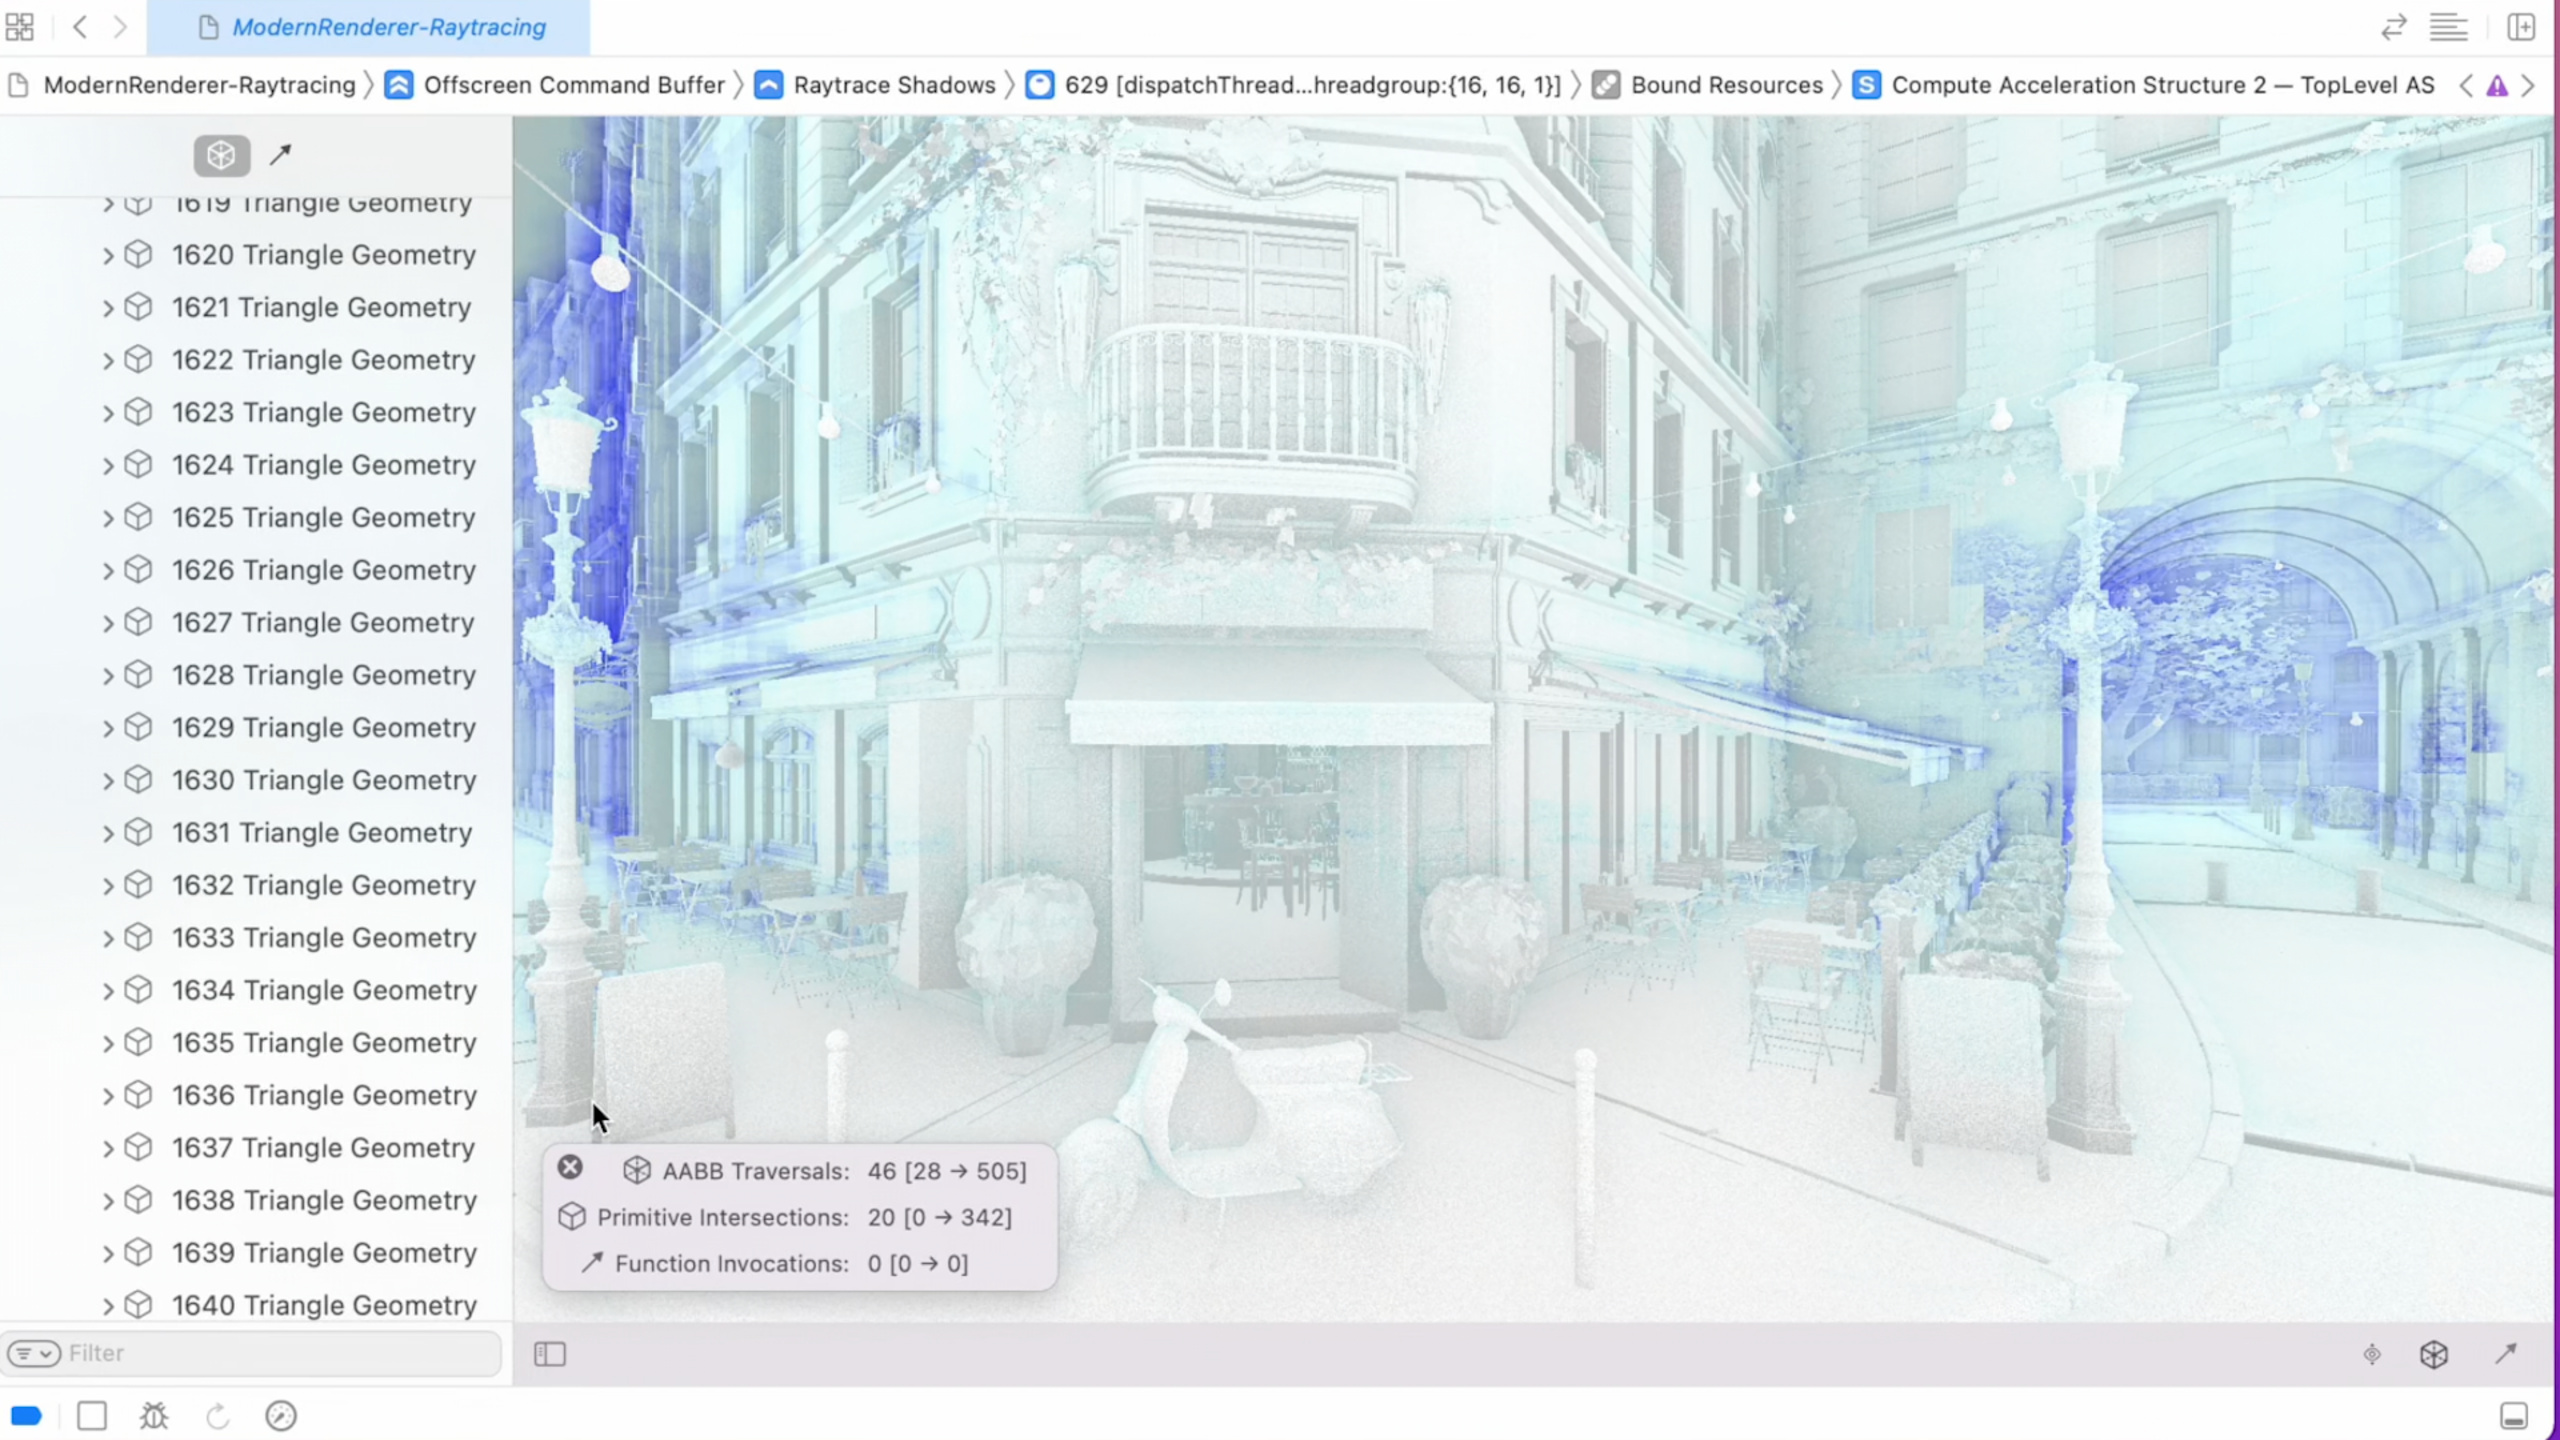
The acceleration structure of light tracing is a black box, and it is difficult to debug if there is a problem. Xcode 13 adds the Acceleration Structure Viewer, which can visualize the hierarchy of BVH.
In GPU Frame Capture, select a ray tracing dispatch, find the acceleration structure in Bound Resources, and click to open the Viewer.
The instance hierarchy tree is displayed on the left side of the Viewer, and the 3D preview is displayed on the right side. Click on an instance to see its bounding box, number of primitives, and transformation matrix.
(02:00)
Key points:
- View acceleration structure in GPU Frame Capture
- The tree structure on the left shows the instance hierarchy
- The 3D view on the right shows the geometry
- Can check the bounding box and transformation of each instance
GPU Timeline
(04:30)
GPU Timeline is a new performance analysis view in Xcode 13. It shows the execution of GPU work in a timeline.
The timeline shows:
- Start time and duration of each render pass and compute dispatch
- Memory bandwidth usage
- tile memory pressure
- Degree of overlap between stages
Through the timeline, you can answer: Which pass is the most time-consuming? Does the GPU have idle cycles? Is bandwidth a bottleneck?
(05:15)
Key points:
- Timeline shows the actual execution sequence of GPU work
- You can zoom in to view the details of a single pass
- Color coding indicates different types of work (render/compute/blit)
- Use GPU counters to view specific indicators
Shader Validation
(08:20)
Xcode 13 extends shader validation coverage with new detections:
- Out-of-bounds memory access
- Uninitialized variable usage
- divide by zero error
- NaN/Inf propagation
How to enable it: Check “Shader Validation” in the Metal option of Scheme.
(09:10)
Key points:
- On during development, off on release
- There is a certain performance overhead
- Can catch shader bugs that are difficult to reproduce in released versions
- Support vertex, fragment and compute shader
Texture Converter
(12:00)
Xcode 13 adds a new command-line texture conversion tool that supports all modern GPU texture formats.
# Convert a PNG to an ASTC compressed texture
xcrun textureconverter input.png -o output.astc -f ASTC_4x4_LDR

# Convert an HDR image to RGBM encoding
xcrun textureconverter input.hdr -o output.rgbm -f RGBM(27:51)
RGBM encoding encodes HDR values into an RGBA8 texture:
// RGBM encoding
float4 encodeRGBM(float3 hdrColor) {
    float maxRGB = max(hdrColor.r, max(hdrColor.g, hdrColor.b));
    float M = saturate(maxRGB / 6.0);
    M = ceil(M * 255.0) / 255.0;
    float3 rgb = hdrColor / (M * 6.0);
    return float4(rgb, M);
}

// RGBM decoding
float3 decodeRGBM(float4 rgbm) {
    return rgbm.rgb * (rgbm.a * 6.0);
}(28:41)
Key points:
- Command line tools integrated into the Xcode toolchain
- Support ASTC, BC, PVRTC and other compression formats
- RGBM encoding allows HDR textures to be stored in 8-bit
- Can be integrated into build scripts
Metal Texture Swizzles
(30:55)
Texture swizzle allows you to rearrange the channel order during sampling without modifying the shader code.
let descriptor = MTLTextureDescriptor()
descriptor.swizzle = MTLTextureSwizzleChannels(
    red: .blue,
    green: .red,
    blue: .green,
    alpha: .one
)(30:55)
Key points:
- Set swizzle on texture creation
- All sampling operations are automatically applied
- Suitable for processing source data in different formats
- Zero runtime overhead
Reconstruct Normal from Height
(31:55)
The texture converter in Xcode 13 supports generating normal maps from height maps.
xcrun textureconverter height.png -o normal.astc -f ASTC_4x4_LDR --generate-normal-map(31:55)
Key points:
- Generate three-channel normal map from single-channel height map
- Supports multiple compression formats for output
- You can specify height scale and wrap mode
Core Takeaways
-
Use Acceleration Structure Viewer to debug light tracing problems. Check whether the bounding box of BVH is reasonable and whether the instance transformation is correct. Entry API: Xcode 13 GPU Frame Capture → Acceleration Structure Viewer.
-
Use GPU Timeline to locate performance bottlenecks. Find the most time-consuming pass and check if there is enough parallel overlap. Entry API: Xcode 13 → Metal GPU Timeline.
-
Always enable Shader Validation during development. Catch shader bugs such as out-of-bounds access and uninitialized variables. Entrance API: Scheme → Metal → Shader Validation.
-
Use texture converter to integrate texture compression into the build process. Automatically convert source textures to GPU compressed format. Entrance API:
xcrun textureconverter。 -
Use texture swizzle to process source data in different channel orders. There is no need to write separate shaders for each format. Entrance API:
MTLTextureDescriptor.swizzle。
Related Sessions
- Optimize high-end games for Apple GPUs — Apple GPU TBDR architecture game optimization
- Enhance your app with Metal ray tracing — Metal ray tracing API
- Create image processing apps powered by Apple silicon — Apple Silicon image processing optimization
Comments
GitHub Issues · utterances