
Highlight
Apple worked with Larian Studios (“Divinity: Original Sin 2”) and 4A Games (“Metro: Exodus”) to summarize a four-step optimization method for high-end games on Apple GPUs: analyze bottlenecks, optimize shaders, reduce memory bandwidth, and increase GPU workload overlap.
Core Content
You take a high-end PC game and port it to Apple Silicon. The graphics look good, but the framerate is choppy, with some scenes suddenly dropping to 20fps. What’s the problem?
Apple GPU uses TBDR (Tile-Based Deferred Rendering) architecture, which is completely different from IMR (Immediate Mode Rendering) on PC. An optimization strategy that works on a PC may be counterproductive on an Apple GPU.
Apple engineers spent a year analyzing multiple games and summed up a systematic optimization method.
Detailed Content
Four-step optimization process
(00:52)
Apple recommends optimizing in this order:
- Analyze Bottlenecks — Use GPU Tools to Find Performance Limiters
- Optimize shader — Reduce ALU and register pressure
- Reduced Memory Bandwidth — Reduce tile memory overflow and texture bandwidth
- Increase workload overlap — Let the GPU handle multiple tasks simultaneously
This order is important. If the bottleneck is memory bandwidth, optimizing the shader will not have a significant effect.
Case analysis: “Divinity: Original Sin 2”
(04:37)
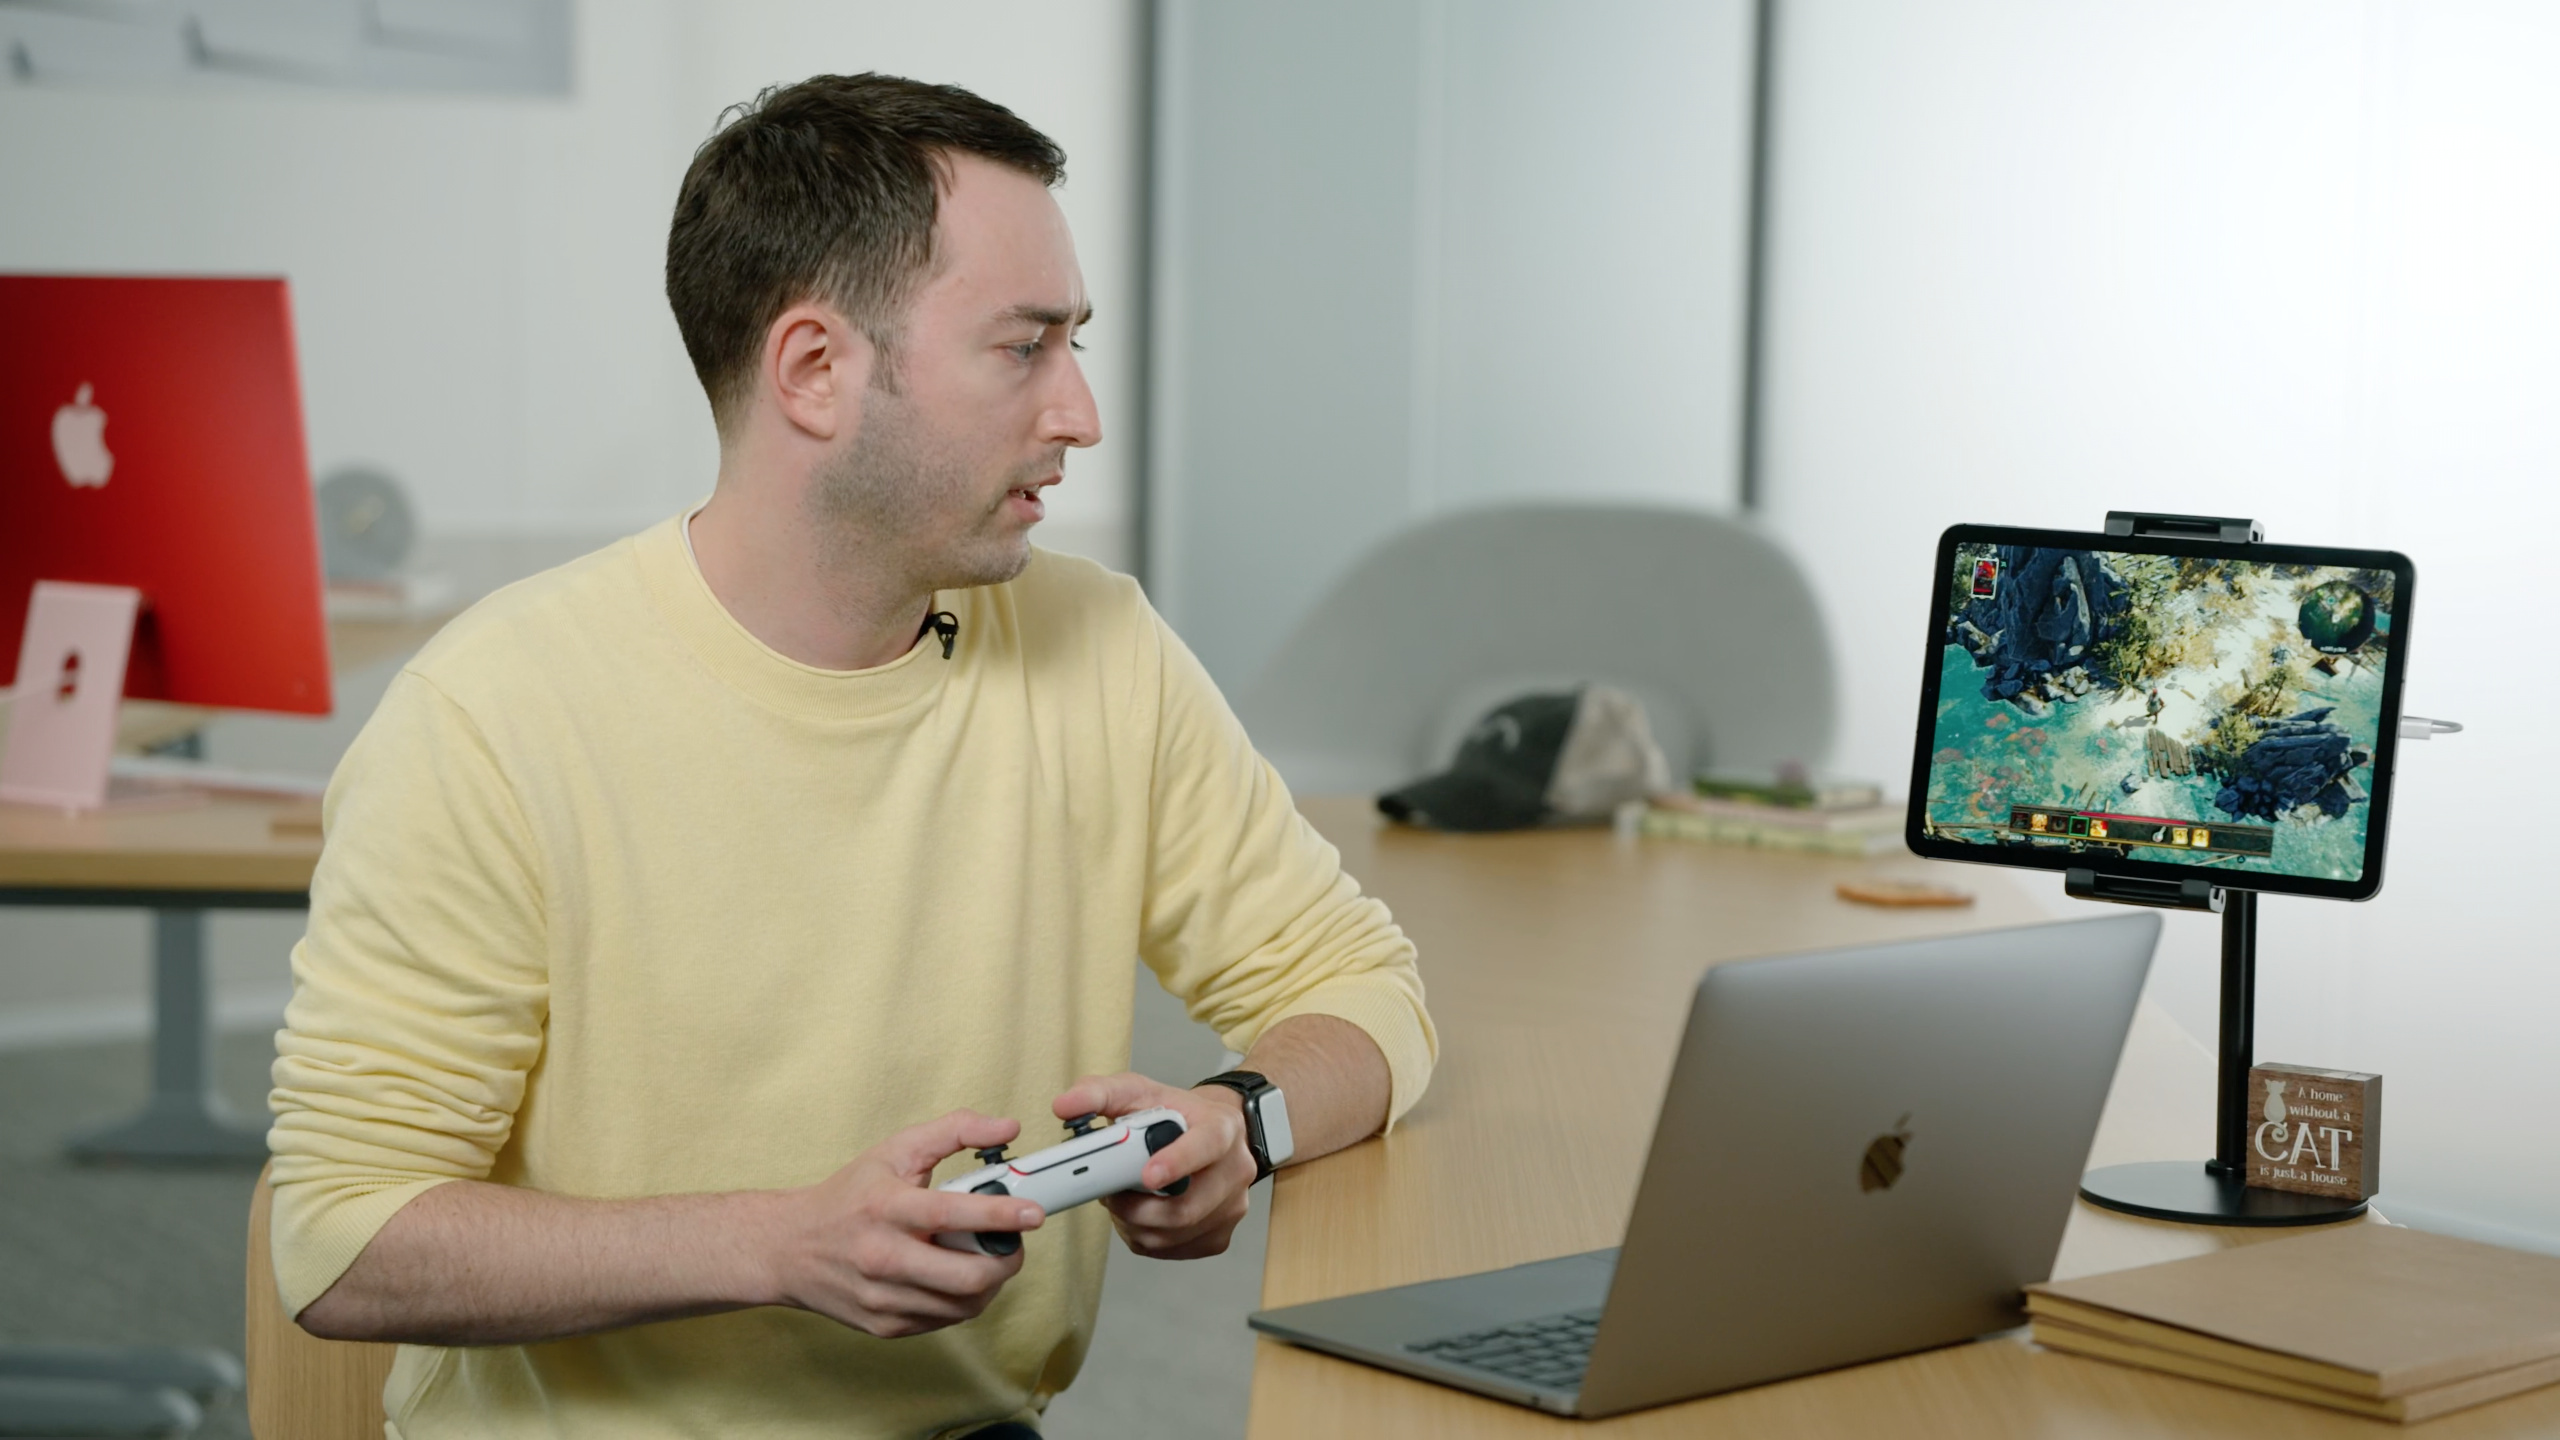
Larian Studios’ Divinity: Original Sin 2 suffers from poor performance in certain scenes when running on the iPad. Apple analyzed it using Xcode 13’s new GPU Timeline tool and found:
Issue 1: Uber-shader register pressure
The game uses a giant uber-shader to handle all materials. This shader contains a large number of conditional branches, but only a small number of them are actually used each frame. Because the shader is too large and register allocation pressure is high, the GPU cannot take full advantage of parallelism.
Solution: Use function constants instead of runtime conditional branches.
// Before optimization: runtime conditional branches, all code occupies registers
fragment float4 uberShader(...) {
    float4 color;
    if (materialType == 0) {
        color = computeMetal(...);
    } else if (materialType == 1) {
        color = computeFabric(...);
    } else if (materialType == 2) {
        color = computeStone(...);
    }
    // ... more branches
    return color;
}

// After optimization: compile-time specialization keeps only the code that is used
[[function_constant(0)]] const bool hasMetal = false;
[[function_constant(1)]] const bool hasFabric = false;

fragment float4 specializedShader(...) {
    float4 color;
    if (hasMetal) {
        color = computeMetal(...);
    } else if (hasFabric) {
        color = computeFabric(...);
    }
    return color;
}(12:25)
Key points:
[[function_constant]]Determine branches at compile time- Unused code is eliminated by the compiler
- Register allocation is more compact
- Need to create pipeline state for each combination, but better runtime performance
Problem 2: Tile memory overflow
The TBDR architecture performs rendering in on-chip tile memory. If there is too much intermediate data in each frame and the tile memory cannot fit it, it will overflow into the main memory and performance will drop dramatically.
Solution: Reduce the bit depth of the render target and merge the render pass.
// Before optimization: multiple render passes, each writes to main memory
Pass 1: G-Buffer (albedo + normal + depth) -> main memory
Pass 2: Lighting -> main memory
Pass 3: Post-processing -> main memory

// After optimization: merge into one render pass and keep data in tile memory
Pass 1: G-Buffer -> Lighting -> Post-processing (completed inside tile memory)(15:24)
Key points:
- The advantage of TBDR is that tile memory bandwidth is much higher than main memory
- Each render pass switch may cause tile data to be written back to main memory
- Merge render pass to keep intermediate data on-chip
- Use memoryless attachment to avoid writeback
Issue 3: Redundant Resource Binding
Each frame repeatedly binds the same buffer and texture, which causes high CPU overhead.
Solution: Use argument buffer to cache binding status.
// Before optimization: bind one by one each frame
[encoder setVertexBuffer:buffer1 offset:0 atIndex:0];
[encoder setVertexBuffer:buffer2 offset:0 atIndex:1];
[encoder setFragmentTexture:texture1 atIndex:0];
[encoder setFragmentTexture:texture2 atIndex:1];

// After optimization: bind once with an argument buffer
[encoder setVertexBuffer:argumentBuffer offset:0 atIndex:0];
[encoder useResources:resources usage:MTLResourceUsageRead];(21:40)
Key points:
- argument buffer packs resource references into a buffer
- Reduce the number of API calls for encoder
- Suitable for scenarios with a large number of resources
- Cooperate
useResources:usage:Tell the driver which resources will be accessed
Case Analysis: “Metro: Exodus”
(16:30)
The main issue with 4A Games’ Metro Exodus on Apple GPUs is the memory access pattern of the compute shader.
Issue: Non-Coalesced Memory Access
The memory addresses accessed by threads in the compute shader are scattered, resulting in low cache efficiency.
Solution: Reorganize the data layout to allow adjacent threads to access adjacent memory addresses.
// Before optimization: threads (x,y) access non-contiguous memory locations
uint index = y * width + x;
float value = input[index];

// After optimization: use threadgroup memory to coalesce access
threadgroup float sharedData[256];
uint localIndex = thread_position_in_threadgroup.x;
sharedData[localIndex] = input[globalIndex];
threadgroup_barrier(mem_flags::mem_threadgroup);
float value = sharedData[localIndex];(18:45)
Key points:
- threadgroup memory is much faster than device memory
threadgroup_barrierMake sure all threads have finished writing before reading- Reorganize the data layout to make the access pattern more regular
- Reducing cache misses is the core of bandwidth optimization
GPU Timeline Tool
(22:30)
The new GPU Timeline in Xcode 13 is a core tool for analyzing performance bottlenecks. It is shown in a timeline:
- GPU time spent per render pass and compute dispatch
- Memory bandwidth usage
- tile memory pressure
- Degree of overlap between stages
You can visually see through the timeline: Which pass takes the longest? Are there idle periods where more work can overlap? Is bandwidth a bottleneck?
Core Takeaways
-
Use GPU Timeline to locate bottlenecks first and then optimize. Don’t optimize based on your feeling. You may find that the bottleneck is in another place after optimizing for a long time. Entry API: Xcode 13 GPU Timeline.
-
Replace the runtime branch of uber-shader with function constants. Unused code is eliminated during compilation, significantly reducing register pressure. Entrance API:
[[function_constant(N)]]。 -
Merge render passes to keep intermediate data in tile memory. Under the TBDR architecture, one large render pass is much more efficient than multiple small render passes. Entrance API:
MTLLoadAction+MTLStoreAction+ memoryless attachment。 -
Check the memory access pattern of the compute shader. Use threadgroup memory to cache frequently accessed data to ensure that adjacent threads access adjacent addresses. Entrance API:
threadgroup+threadgroup_barrier。 -
Use argument buffer to reduce the resource binding overhead of each frame. Especially suitable for scenarios with a large number of resources. Entrance API:
MTLArgumentEncoder+useResources:usage:。
Related Sessions
- Optimize for variable refresh rate displays — Adaptive-Sync and ProMotion frame rate optimization
- Enhance your app with Metal ray tracing — Metal ray tracing API
- Create image processing apps powered by Apple silicon — Apple Silicon image processing optimization
- Discover Metal debugging, profiling, and asset creation tools — Xcode 13 Metal debugging and performance analysis tools
Comments
GitHub Issues · utterances