
Highlight
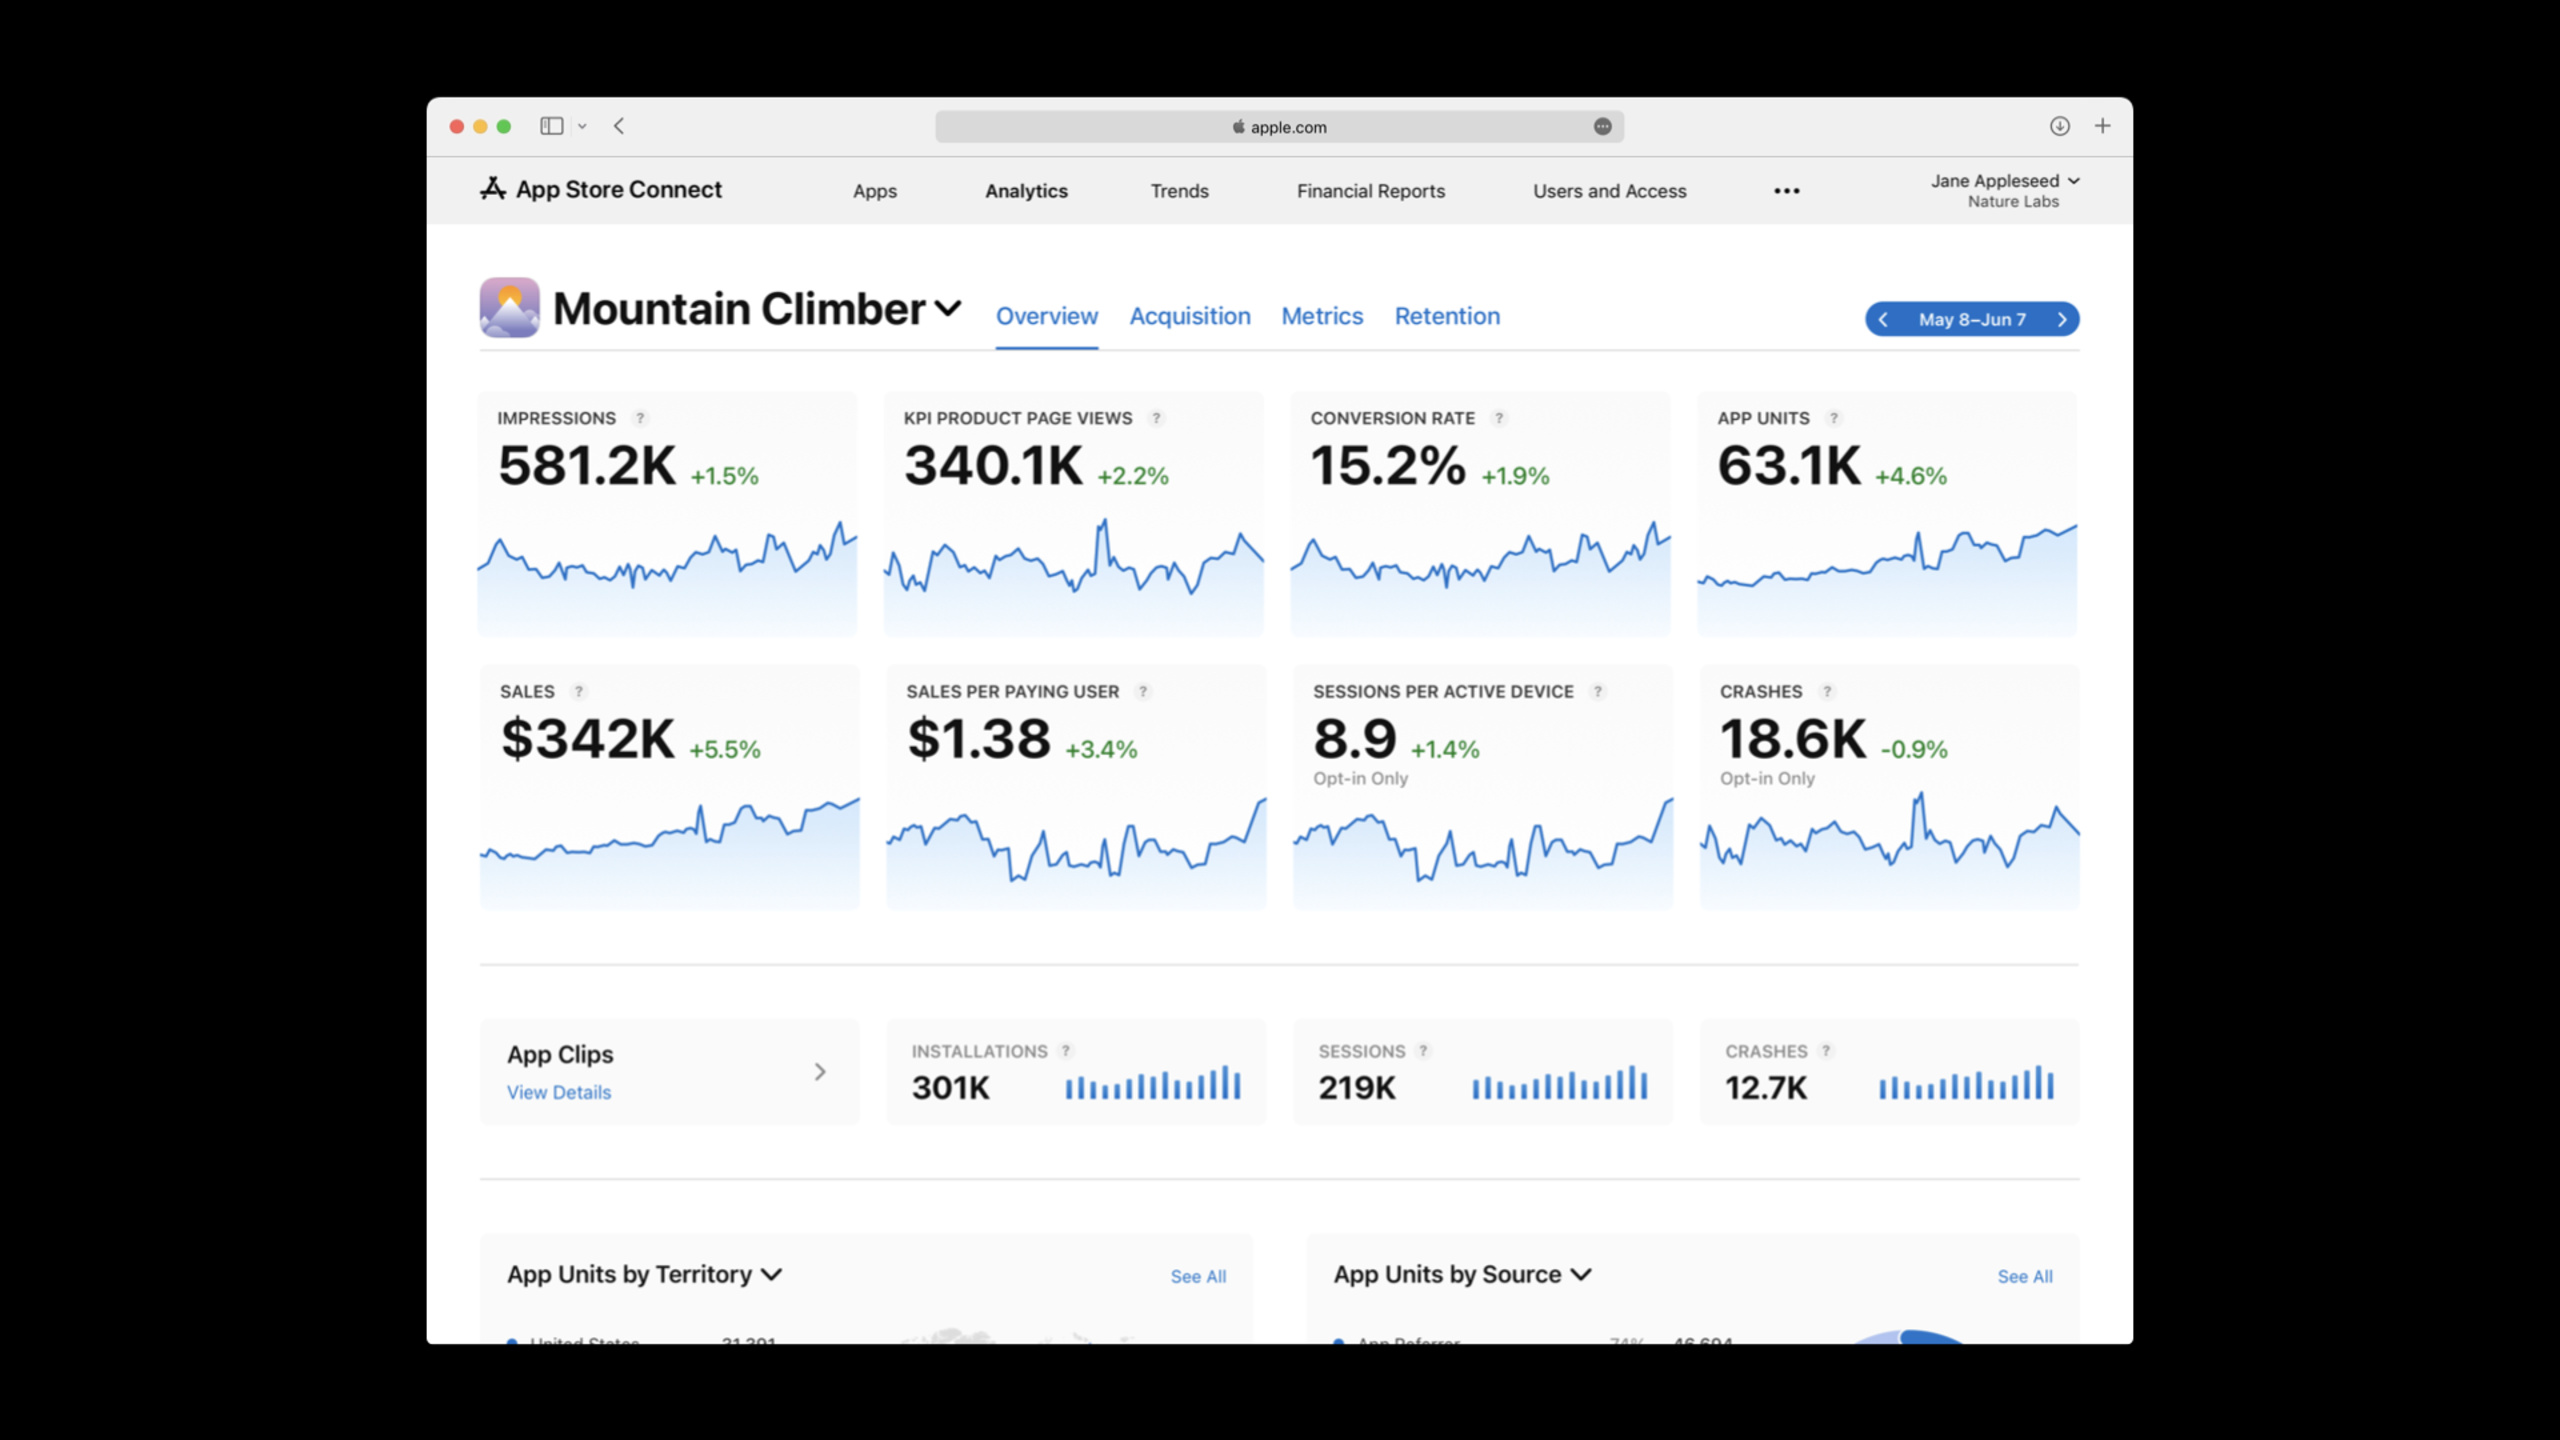
App Analytics adds transaction metrics, macOS usage data, App Clips analysis, product page optimization and in-app activity performance measurement at WWDC21, allowing developers to track App Store distribution and marketing performance without adding code.
Core Content
The most difficult questions to answer before a developer releases an app often occur outside of the App Store.
How much interest does the pre-order page generate?Will revenue increase after launch?How many users have updated the new version?Have the uninstalled users come back?These data determine marketing budgets and product cadence, but previously there was a lack of unified access.
Apple has completed this link in App Analytics.It provides a new set of transactional metrics from pre-orders, purchases, updates, re-downloads, to total downloads.Developers can see store-side data in App Store Connect without adding hidden points in the app.
This speech uses Mountain Climber, a mountain climbing live streaming app, as an example.The developers first set up pre-orders for the Half Dome live stream and observed which regions and sources brought in the most pre-orders.After the app is online, look at Proceeds (revenue), Updates (updates), Re-downloads (re-downloads) and Total Downloads (total downloads).
Apple is also extending its analysis to new distribution scenarios.Apple Silicon Macs can automatically run iPhone and iPad apps, and App Analytics can now view Mac usage by device dimension.App Clips (light apps) also have independent analysis pages to observe card exposure, sessions, crashes and install conversions.
Finally, the App Store is adding three marketing capabilities in fall 2021: Product Page Optimization, Custom Product Pages, and In-App Events.App Analytics provides supporting dashboards for these capabilities, allowing developers to put page materials, ad landing pages, and event operations into the data for inspection.
Detailed Content
Transaction Metrics: From pre-orders to re-downloads
(01:23) Apple first expanded trading-related indicators.The new content covers Pre-Orders, Proceeds, Updates, Re-downloads and Total Downloads.
There is no Code tab code snippet in this field.The executable entry of App Analytics is used here to represent the operation method.
App Store Connect
→ App Analytics
→ Select App: Mountain Climber
→ Pre-Order Dashboard
→ Metrics: Impressions / Product Page Views / Pre-Orders
→ Dimensions: Device / Source Type / Territory
Key points:
App AnalyticsIt is the entrance. The data comes from the App Store ecosystem and does not require the App to add code.Pre-Order Dashboardis a new pre-order dashboard for observing market interest ahead of launch.ImpressionsIndicates the number of page impressions.Product Page ViewsIndicates the number of product page visits.Pre-OrdersIndicates the pre-order quantity.Device、Source Type、TerritoryUsed to split pre-order sources and help developers decide where to invest marketing resources.
(04:08) After the App is online, developers can choose from the indicator drop-down menuProceeds, to see how revenue changes over time.
App Analytics
→ Metrics dropdown
→ Proceeds
→ Chart: Proceeds over time
Key points:
Metrics dropdownIndicator used to switch the current chart.ProceedsTo demonstrate transactional benefits, the presentation example is a user paying $0.99 for access to a Half Dome live stream.ChartDisplay revenue changes over time, suitable for observing revenue trends after launch, activities, or version updates.
(04:41) After the new version is released,UpdatesThe metric shows the number of users updating to a new version.
App Analytics
→ Metrics dropdown
→ Updates
→ Chart: Updates over time
Key points:
UpdatesCount the number of customers who have updated to the new version of the app.- This metric answers a direct question: how many users have been reached by the new feature.
- If the update curve is growing slowly, developers can adjust release notes, in-app prompts, or marketing cadence.
(05:17) Apple added Re-downloads, used to observe when users who have deleted the app reinstall it.
App Analytics
→ Metrics dropdown
→ Re-downloads
→ Dimensions: Territory / Device
Key points:
Re-downloadsIndicates the number of redownloads.TerritoryHelp locate the markets where return of old users occurs.DeviceHelps determine whether backflow is concentrated on certain types of equipment.- This metric is suitable for evaluating the performance of recall campaigns, major updates, and seasonal content.
(05:40)Total DownloadsCombine First-time Downloads and Re-downloads to give the complete number of store downloads.
Total Downloads = First-time Downloads + Re-downloadsKey points:
First-time DownloadsIndicates getting the app downloaded for the first time.Re-downloadsIndicates reinstallation.Total DownloadsIt is suitable to look at the overall download pressure and distribution scale.- When evaluating new user growth, you need to look at first downloads separately to avoid counting returning users as new users.
macOS data: Watch how iPhone and iPad apps perform on Mac
(06:14) Apple Silicon Macs can run iPhone and iPad Apps.Developers can make these apps reach Mac users without requiring additional code.App Analytics adds new usage data.
App Analytics
→ Dimension dropdown
→ Device
→ Device category: Desktop
→ Metrics: Sessions / Installations / Active Devices / Crashes / Deletions
Key points:
Dimension dropdownUsed to select the data splitting method.DeviceSplit usage by device type.DesktopCategory contains macOS data.SessionsTo demonstrate session volume, the presentation example Mountain Climber had over 6 million Mac sessions in the last 30 days.CrashesUsed to determine whether the app is stable on Mac.DeletionsReflects user deletion behavior, suitable for analysis together with crashes and sessions.
(07:20) Speech specially viewedCrashes.When there are many Mac sessions and few crashes, it means that the iPhone or iPad app is running stably in the desktop environment.
App Analytics
→ Device: Desktop
→ Metrics dropdown
→ Crashes
→ Compare with Sessions
Key points:
Device: DesktopLimit analysis to Macs.CrashesJust looking at the number of crashes is not enough, it needs to be combinedSessions。- High sessions and low crashes indicate that the current version is performing healthily on Mac.
- If crashes suddenly increase, return to Xcode Organizer or the crash log tool to locate the problem.
App Clips: See the Funnel of Lightweight Experience
(07:54) App Clips allow users to order food, rent a car, set up devices, and more in seconds.App Analytics has added a dedicated analysis area for App Clips to observe how users discover and use Clips.
App Analytics
→ Overview
→ App Clips ribbon
→ Metrics: Installations / Sessions / Crashes
→ View Details
Key points:
OverviewApp Clips exclusive data bar appears on the page.InstallationsIndicates the number of times a clip was used to enter a full app installation.SessionsIndicates the number of sessions for the Clip.CrashesIndicates the number of Clip crashes.View DetailsGo to the more detailed App Clips analysis page.
(08:47) The detailed page displays Card Views, Sessions, Crashes, Installations and Top Territories (main regions).
App Clips Details
→ Card Views
→ Sessions
→ Crashes
→ Installations by source
→ Top Territories by Card Views / Installations / Sessions
Key points:
Card ViewsIndicates the number of times the Clip card that pops up on the user’s phone has been viewed.SessionsIndicates the session where the user actually enters the Clip.Installations by sourceShow where full app installs come from.Top TerritoriesCan be viewed by card, installed, and session switched.- This set of metrics can locate funnel breakpoints: when a user sees a card but doesn’t open it, or opens a clip but doesn’t install the full app.
Product page optimization: Use conversion rate to select materials
(10:16) Product Page Optimization allows developers to test different variations of the default product page, such as icons, screenshots, and preview videos.App Analytics offers a new dashboard to help compare conversion rates across variations.
App Store Connect
→ Product Page Optimization
→ Create variants of default product page
→ App Analytics dashboard
→ Compare conversion rate
→ Statistical analysis: Bayesian methodology
→ Stop test at any time
Key points:
Product Page OptimizationDo variation testing on the default product page.variantsDifferent visual materials can be used.conversion rateIt is the core metric for judging which variant performs better.Bayesian methodologyIt is the statistical analysis method mentioned by Apple in the speech.Stop test at any timeIndicates that developers can stop testing at any time.
Customized product pages: give different landing pages to different audiences
(11:08) Custom Product Pages allow developers to customize product page content for different audiences and direct traffic to more relevant pages.App Analytics displays independent metrics for each page.
App Store Connect
→ Custom Product Pages
→ Create page for a specific audience
→ Drive traffic to that page
→ App Analytics metrics:
   Product Page Views
   Downloads
   Conversion Rate
   Proceeds
   Retention
Key points:
Custom Product PagesShow different content to different audiences.Drive trafficCan come from advertising, social media or event links.Product Page ViewsRepresents custom page views.DownloadsandConversion RateDetermine whether the page brings installation.ProceedsandRetentionHelp determine whether this audience brings long-term value.
In-App Events: Measure event performance on the App Store
(11:50) In-App Events can promote app experiences that occur at a specific time in the App Store, such as a game competition, live event, or content premiere.App Analytics provides campaign performance data.
App Store Connect
→ In-App Events
→ Publish event page
→ App Analytics metrics:
   Impressions
   Notify Me
   Downloads from event page
   App Opens from event page
Key points:
ImpressionsRepresents the number of impressions of the campaign on the store.Notify MeRepresents the number of users who requested event start reminders.Downloads from event pageRepresents the number of users who downloaded the app from the active page.App Opens from event pageIndicates the number of times the user opened the app from the active page.- This set of indicators can determine whether the activity attracts the user’s attention and leads to actual opening behavior.
Core Takeaways
1. Pre-order popularity panel before release
- What to do: Build a pre-order monitoring dashboard for new apps or large version launches to track pre-order changes by region and source.
- Why it’s worth doing: The pre-order dashboard can display Impressions, Product Page Views and Pre-Orders, and supports splitting by Device, Source Type, and Territory.
- How to start: Set up pre-orders in App Store Connect; check the Pre-Order Dashboard every day before going online; add areas with concentrated pre-orders to the first batch of advertising and localized material priorities.
2. Version coverage tracking
- What to do: After each new version is released, use the Updates metric to track the speed of new feature coverage.
- Why it’s worth doing: Updates directly shows how many customers have updated to the new version, suitable for evaluating whether new features have actually reached users.
- How to start: After releasing version 1.1, enter App Analytics and select
Updates; Review the update curve together with customer service issues, in-app activities, and version description adjustments.
3. Apple Silicon Mac Health Check
- What to do: Add Mac usage inspection for iPhone or iPad App, focusing on Sessions, Crashes and Deletions.
- Why it’s worth it: Apple Silicon Mac can automatically run iPhone and iPad apps, and App Analytics can display usage data under the Desktop category.
- How to get started: Select in App Analytics
DeviceDimension, filter Desktop; if there are many Mac sessions and few crashes, you can continue to optimize the desktop experience; if crashes increase, first troubleshoot the input, window, and media playback scenarios on the Mac.
4. App Clip Conversion Funnel
- What to do: Create a weekly funnel report for Card Views, Sessions and Installations of the App Clip.
- Why it’s worth doing: The App Clips detailed page displays card views, sessions, crashes, installation sources and main regions, which can locate the loss points of lightweight experience.
- How to start: Enter App Clips Details; record
Card Views → Sessions → Installations; If there are many card views but few sessions, optimize the card copy; if there are many sessions but few installs, optimize the complete app guidance within the Clip.
5. Product page material experiment calendar
- What to do: Create a Product Page Optimization experiment plan for icons, screenshots, and preview videos.
- Why it’s worth doing: Product Page Optimization provides conversion rate comparison and Bayesian statistical analysis, and you can use data to select materials.
- How to start: Choose a high-traffic market as a starting point for testing; prepare 2 to 3 sets of visual materials; create a test in App Store Connect; observe the conversion rate on the App Analytics dashboard; apply the winning materials to the default page after the test.
Related Sessions
- Get ready to optimize your App Store product page — Explain the material preparation, configuration entry and testing methods of custom product pages and product page optimization.
- Meet in-app events on the App Store — Explains how in-app events appear on the App Store, and how to create, schedule, and manage events.
- What’s new in App Clips — Explains the new entrance, local testing and App Clip Codes of App Clips, suitable for use with the App Clips analysis page.
- Qualities of great iPad and iPhone apps on Macs with M1 — Explains the experience adaptation of iPhone and iPad Apps when running on Apple Silicon Mac.
Comments
GitHub Issues · utterances