
Highlight
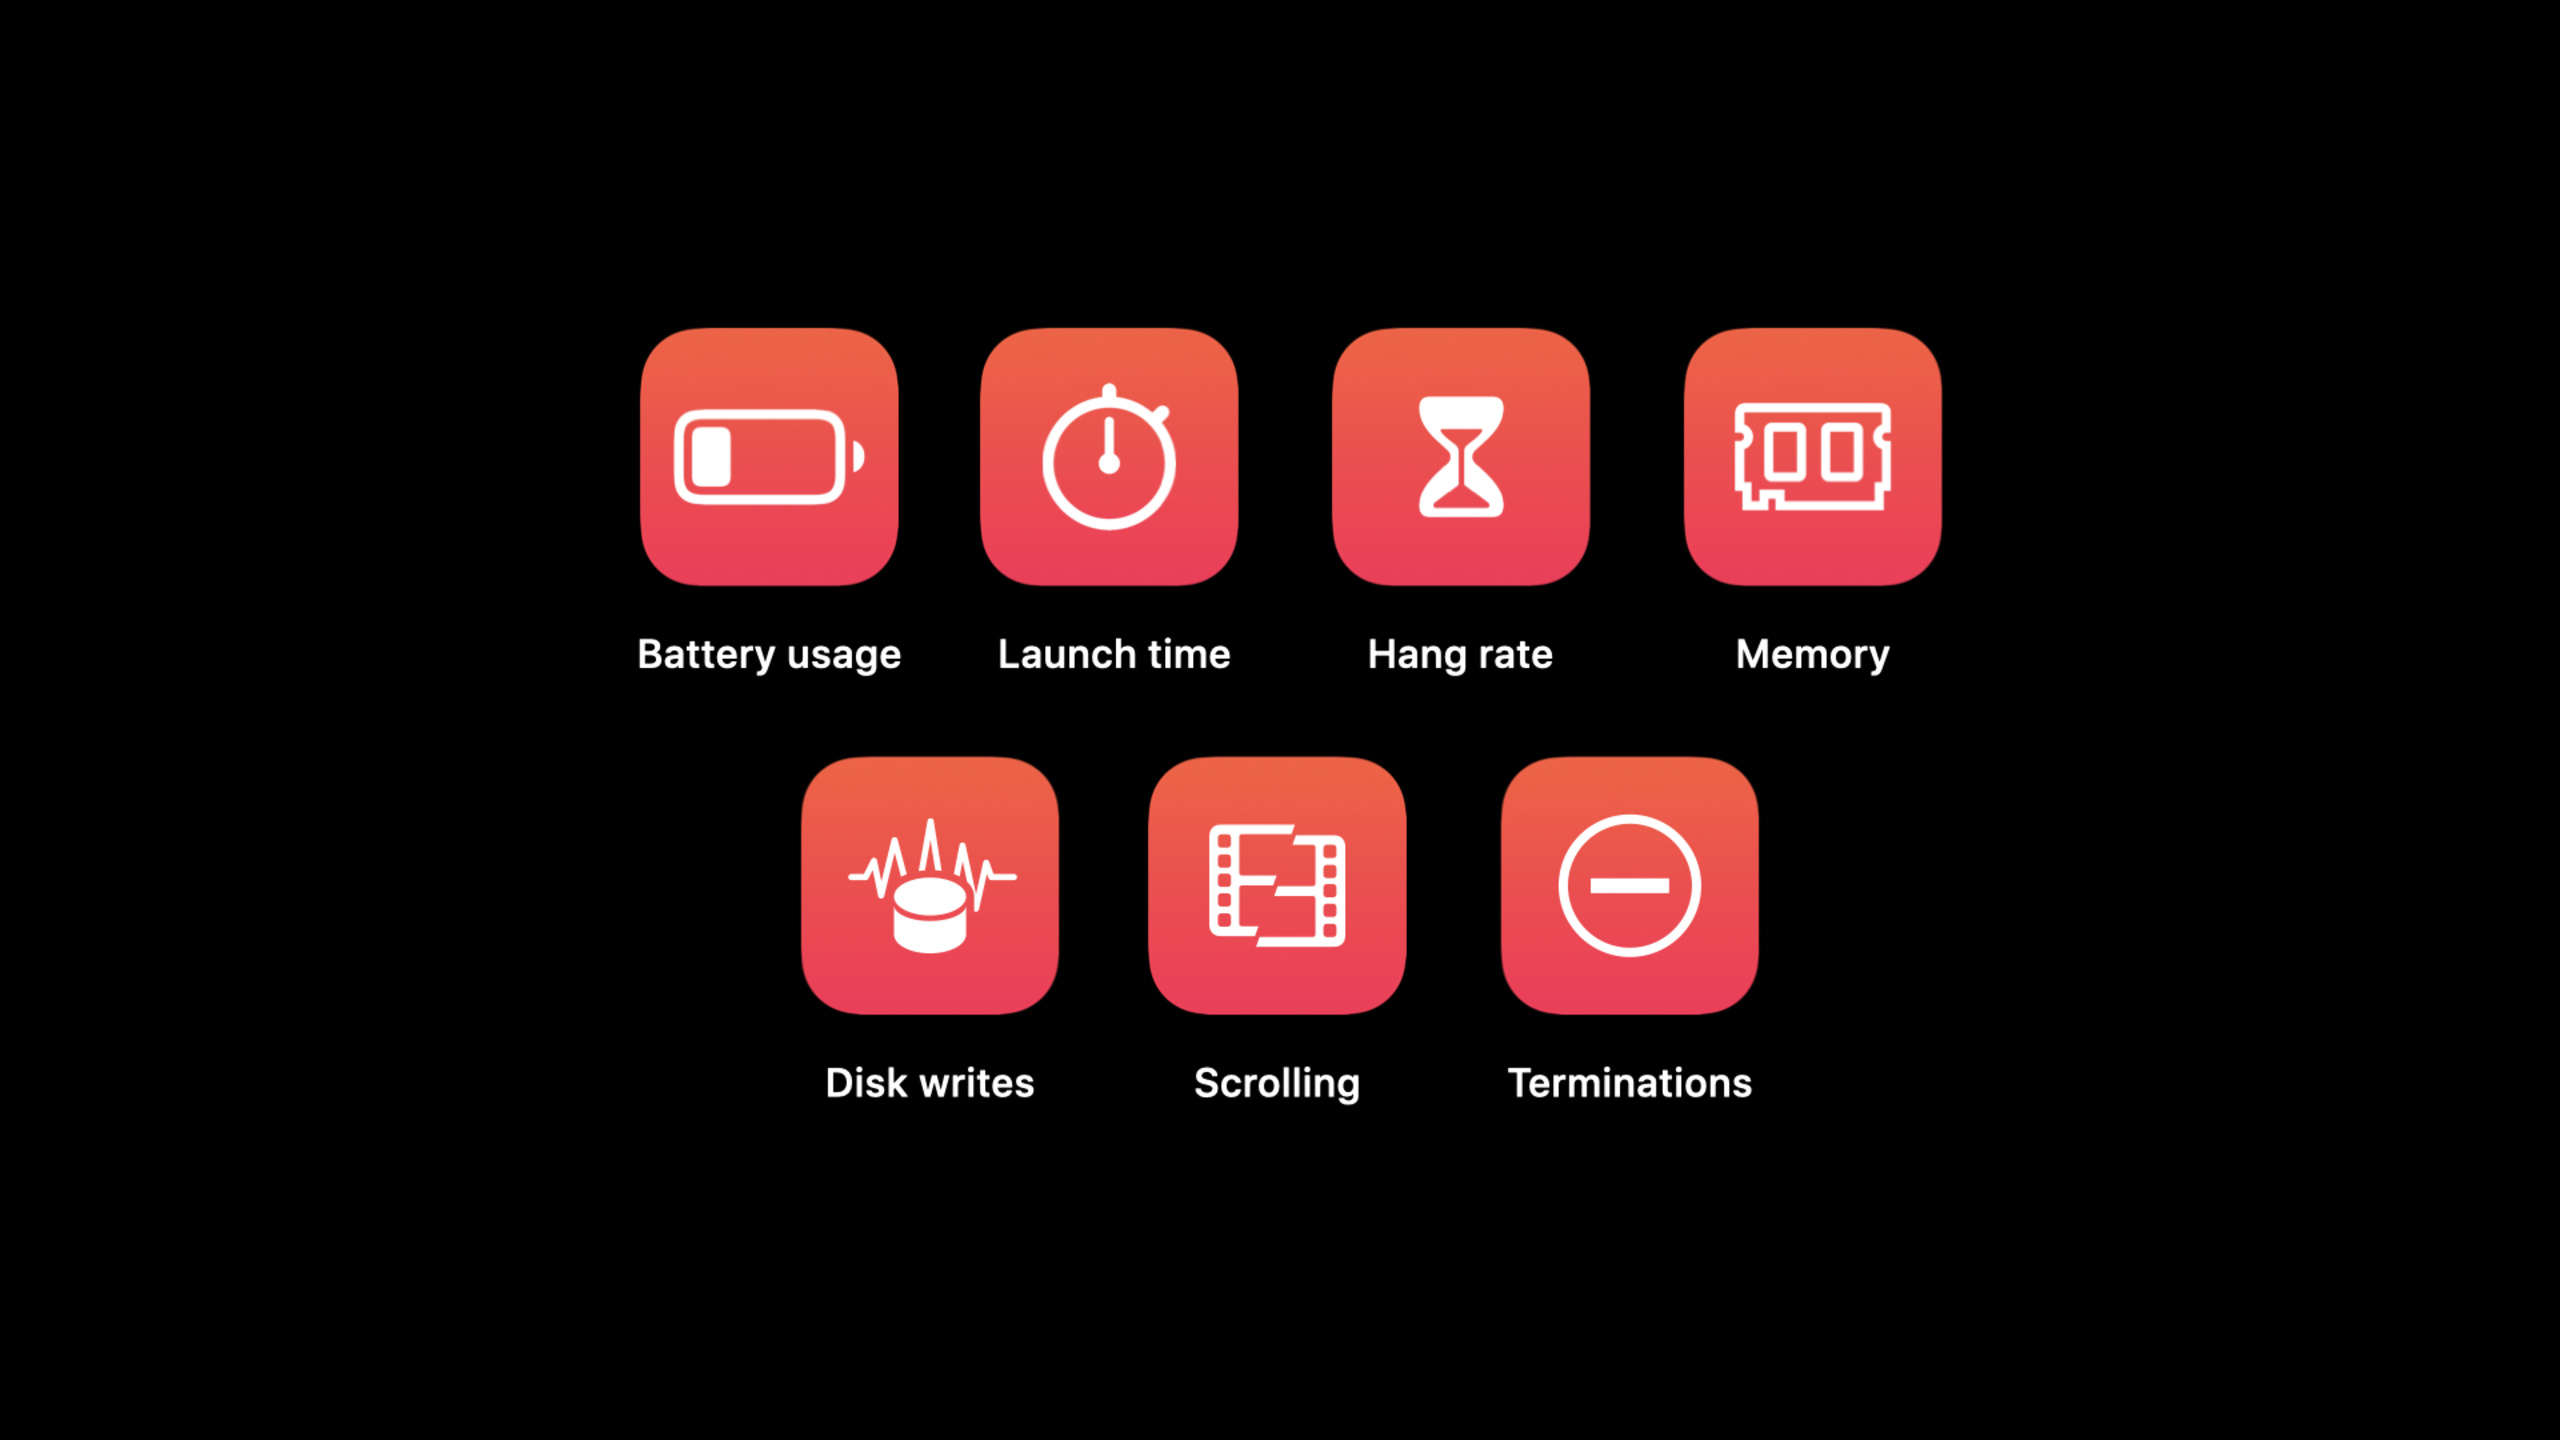
Xcode Organizer adds a Regressions tab, which automatically compares the performance data of the last 16 versions, marks the degradation trend of seven indicators including battery, startup time, hang, memory, disk writing, scrolling lag, and abnormal termination, and breaks it down by device and user percentile.
Core Content
You just released a new version.Users reported “a bit stuck” and “power consumption quickly”.You want to locate the problem, open Xcode Organizer, and face seven major categories of indicators, dozens of device models, and different data on typical users vs. high-frequency users. There is so much information that you don’t know where to start.
The solution for WWDC21 is: let the system find the problem for you.
Xcode Organizer has a new Regressions tab.It automatically analyzes performance data from the past 16 versions and identifies which metrics have become significantly worse in the latest version.Each regression is labeled: what metric is degraded, by how much, which devices and which user groups are affected.
You open the Regressions tab and see three problems: abnormal terminations have increased, background task timeouts have increased, and disk writes have increased by 28%.Sort by severity and resolve them one by one.
Detailed Content
Detection principle of Regressions
(03:01)
The system performs trend analysis on each indicator:
- Take the average of the most recent versions as the baseline
- Compare the latest version’s values to the baseline
- If the trend is upward and the latest value is significantly higher than the baseline, mark it as regression
Example: The average startup time of the app is 1.1 seconds, and the latest version suddenly jumps to 2.5 seconds. The Regressions tab will highlight this issue.
Key points:
- Analysis covers the last 16 versions
- Supports filtering by device model and typical/high-frequency user percentile
- Regression is displayed grouped by indicator categories and subcategories
Abnormal termination return
(04:52)
Abnormal termination is divided into two categories: foreground crash (Illegal Instruction) and background timeout (Task Timeout).
Foreground crashes are the worst – when the user is using the app and is suddenly redirected to the home screen.A common cause is accessing an invalid function pointer.Regressions will show:
- Crash type (Illegal Instruction / Bad Access, etc.)
- Affected devices and percentiles
- Trend chart of the last four versions
- Average vs latest value
Sample data: Latest version crashes 1 time every 10 days (high frequency users).Repair direction: Check if there are any abandoned ones@objcThe method was called, or the third-party SDK used an invalid pointer.
Key points:
- Foreground crashes cause the greatest damage to the user experience, so priority should be given to repairing them.
- Combined with Crash Diagnostics to view specific stacks
- Refer to WWDC21 “Why is my app getting killed?” session to learn more about the reasons for termination
Background task timeout return
(06:27)
The app has 30 seconds to execute after it is switched to the background, and will be terminated by the system after timeout.Regressions show: The latest version is terminated by the background once every 3 days.
Background terminations are less impactful than foreground crashes, but occur more frequently.The user needs to restart the app the next time he switches back to it, resulting in a slow start experience.
Repair direction:
- Check whether the background task is called at the appropriate time
endBackgroundTask - use
backgroundTimeRemainingSave progress in advance - Integrate UIKit’s State Restoration to ensure seamless recovery after termination
Key points:
- Background terminations are usually more frequent than foreground crashes
- 30 seconds is a hard limit and cannot be extended
- State Restoration can mask the negative effects of background termination
Disk write regression and anti-pattern detection
(08:47)
Excessive disk writing will wear out the storage hardware, cause UI freezes, and consume power.Regressions show a 28% increase in disk writes.
Organizer in Xcode 13 adds a new Insights field to the disk write report.The system maintains a library of known anti-patterns, automatically scans reported stacks, and directly provides optimization suggestions when anti-patterns are matched.
Example: Top Signature accounts for 67% of writes, stack points to SQLite operations.Insights suggests: “Add an index”.
Use File Activities Instruments to verify the repair effect:
- Before fix: temporary file writes 180MB, introducing 780ms delay
- After adding the index: the function’s writes drop to 0 and the delay disappears
Key points:
- Insights covers common anti-patterns such as missing SQLite indexes and excessive writing to temporary files
- The anti-pattern library will continue to expand
- File Activities Instruments is the best tool to verify the repair effect
App Store Connect API
(12:57)
If you have a custom analysis pipeline, you can use the API to obtain the same data programmatically:
# Performance metrics and regression insights
GET /v1/apps/{application-id}/perfPowerMetrics
GET /v1/builds/{id}/perfPowerMetrics

# Diagnostic signatures and logs
GET /v1/builds/{id}/diagnosticSignatures
GET /v1/diagnosticSignatures/{id}/logs
In the returned JSON structure,insightsContains all detected regressions,populationsList affected devices and percentiles.The diagnostic signature’s response includes a detailed stack and links to optimization recommendations.
Key points:
- The data returned by the API is exactly the same as Xcode Organizer
- Suitable for integration into existing monitoring platforms
- It is recommended to set up an automated process to pull data after each release
Core Takeaways
-
Incorporate “checking Regressions” into the release process.One week after the release, open the Regressions tab of Xcode Organizer and process them in order of severity: Abnormal termination > Task timeout > Disk writing > Other indicators.Entry: Xcode → Window → Organizer → Regressions.
-
Add appropriate indexes to the SQLite table.If the Top Signature of the disk write report points to a SQLite operation, there is a high probability that a full table scan is caused by a missing index.use
EXPLAIN QUERY PLANLocate slow queries and verify write volume changes in File Activities Instruments after adding indexes.Entrance: Xcode Organizer → Disk Writes → Insights. -
Add time budget check to background tasks.Check periodically in background task execution loop
backgroundTimeRemaining, save the progress and end automatically when less than 10 seconds.Avoid passively waiting for the system to terminate.Entrance:UIApplication.shared.backgroundTimeRemaining。 -
Use App Store Connect API to build a performance monitoring pipeline.Write scheduled tasks to pull every day
/v1/builds/{id}/perfPowerMetrics, store the data into the time series database.Set an alarm: notify the team when a certain indicator degrades by more than 20%.Entrance: App Store Connect API + custom dashboard. -
Follow the data of Top Percentile users.Data for typical users may look normal, but high-frequency users (Top Percentile) are often the first to experience performance issues.Organizer supports viewing the data of two types of users separately and prioritizes the regression of Top Percentile.Entry: Organizer percentile filter in the upper right corner.
Related Sessions
- Why is my app getting killed? — Learn more about the various reasons why apps are terminated by the system and repair strategies
- Identify trends with Power and Performance API — Detailed explanation of WWDC20’s App Store Connect API performance indicators
- Triage TestFlight crashes with Xcode — Diagnosing TestFlight crash reports with Xcode
- Improve your app’s responsiveness — Practical tips to improve application responsiveness
Comments
GitHub Issues · utterances