
Highlight
Web Inspector adds CSS Grid visual overlay, full-type breakpoint configuration and Audit editing mode, making the Safari debugging experience equal to that of Chrome DevTools.
Core Content
Debugging CSS Grid has always been a pain point in front-end development.You write in the Styles panelgrid-template-columns: 1fr 2fr 1fr, but where the element actually falls can only be determined by mental calculation.Grid is too nested, making it difficult to locate layout problems.
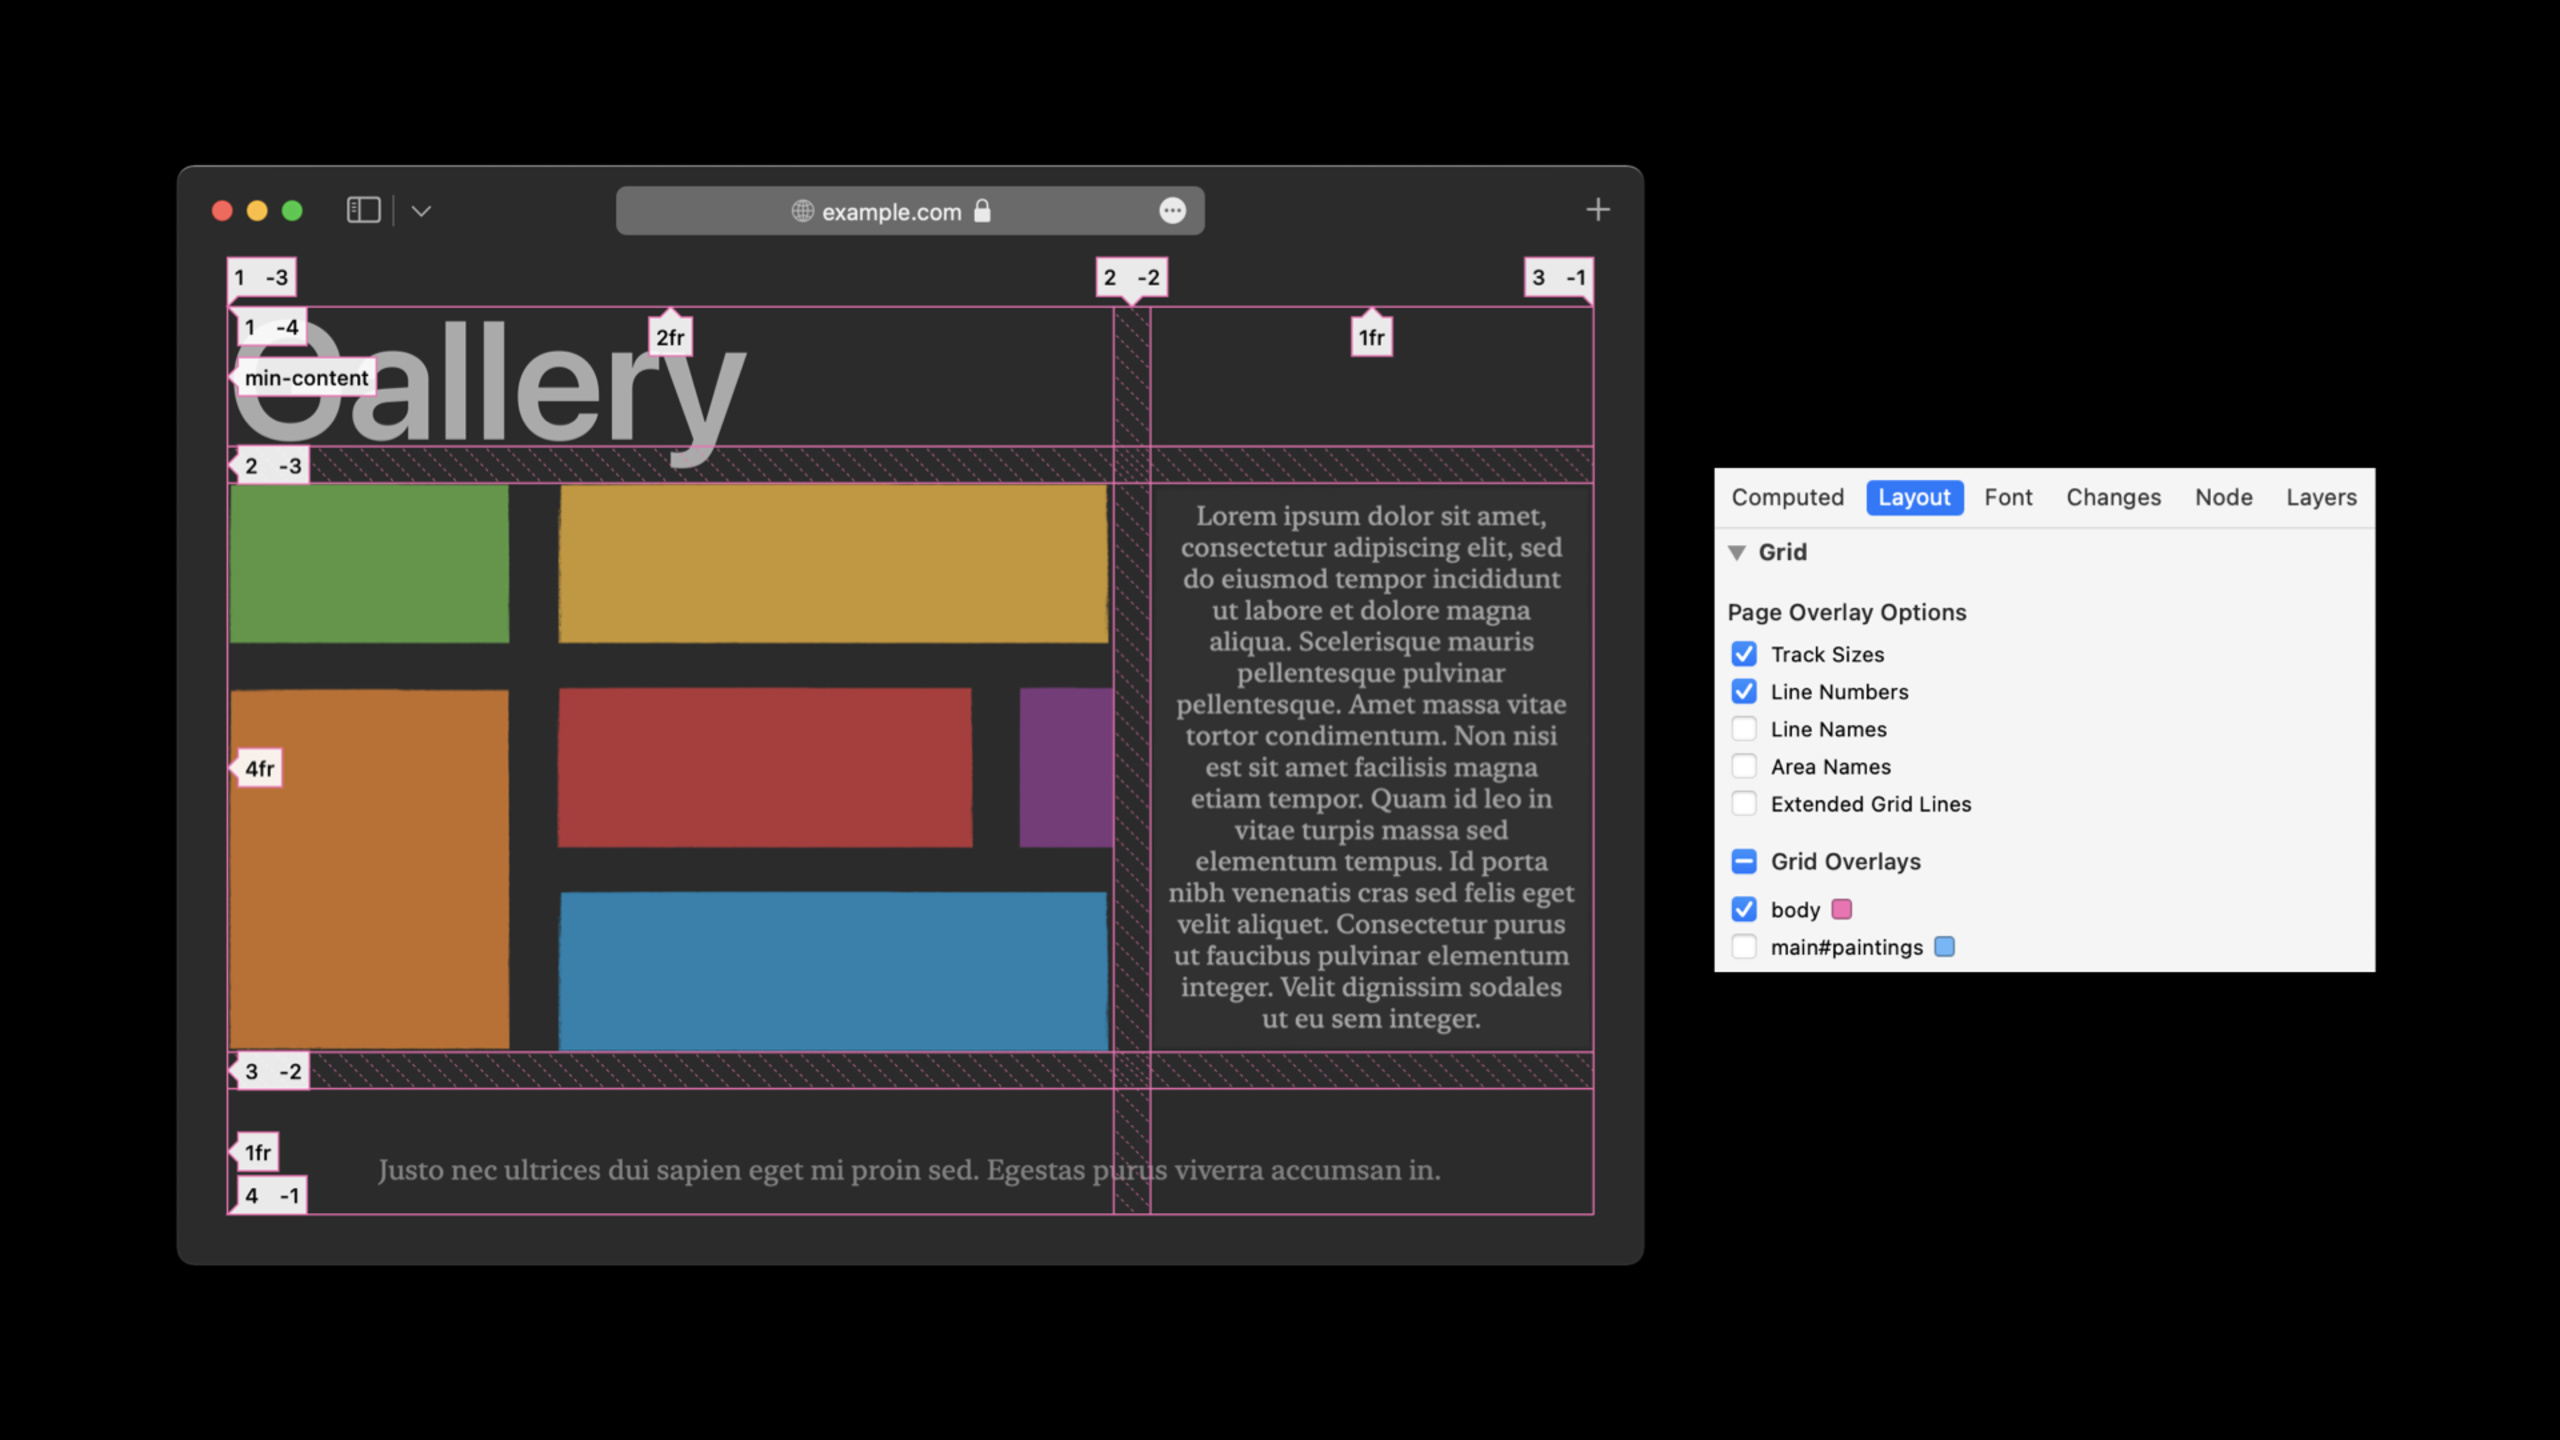
Web Inspector added Grid Overlay this year.A badge will appear next to each Grid container in the DOM tree. After clicking, the grid lines, track size and area name will be drawn directly on the page.You can open multiple Grid overlays at the same time, and there will be no lag when scrolling.
In terms of breakpoints, previously only JavaScript line breakpoints supported conditional judgments and custom actions.Now all breakpoint types—event breakpoints, DOM breakpoints, URL breakpoints, exception breakpoints—can be assigned conditions and actions.You can set conditions on the click event to only pause on a specific button; you can also add actions to the network request breakpoint to automatically play the prompt sound.
The Audit function could only import and export JSON for editing.This year, Edit Mode has been added to write test code directly in Web Inspector.A set of Accessibility tests are built-in, and you can also customize rules to check design system compliance.
Detailed Content
CSS Grid visual overlay
The way to turn it on is simple:
- Find the Grid container in the Elements panel and click the Grid badge next to it (01:20)
- A colored grid overlay appears immediately on the page
- In the Layout panel, you can turn on and off all Grid overlays, or control one individually.
Display options provided by the Layout panel:
- Track Sizes: Display the track size of each row/column, such as
1fr、min-content(04:04) - Line Numbers: Displays positive and negative line number clues.Negative numbers count down from the last explicit grid line, which is convenient to use.
-1、-2Doing adaptive positioning (04:15) - Line Names: Displays explicitly named grid lines and generated line names based on zone names (04:34)
- Area Names: Display names in the center of the area and outline the area boundaries with thick lines (04:43)
- Extended Grid Lines: Extend the grid lines to the edge of the page to facilitate alignment and comparison with other elements (04:58)
The overlay performance has been optimized, and dozens of Grids can be displayed simultaneously with smooth scrolling (05:11).Supports all writing modes: vertical text, RTL orientation, and combined mode (05:26).Also available when debugging remotely on iOS 15 and iPadOS 15 (05:35).
Actual debugging scenario:
/* Use Grid Overlay to locate a misaligned element */
.emoji-tile {
    grid-area: 4 / 6;  /* Row 4, column 6 */
}

/* Switch to negative line clues to adapt to grid changes */
.emoji-tile {
    grid-area: -3 / -3;  /* Third row/column from the end, always kept in the lower-right corner */
}
Key points:
- Grid badge identifies all Grid containers in the Elements tree (02:35)
- Overlay colors are customizable and Web Inspector remembers settings (03:42)
- You can view the Layout panel and Styles panel at the same time in the three-column layout (08:08)
- Negative line number clues make layout more flexible (09:02)
Breakpoint enhancement: all types support configuration
Web Inspector has five breakpoint types (10:34):
- Debugger/Exception/Assertion Breakpoint — in
debuggerPause when statement or exception is thrown - JavaScript Breakpoint — Pause at a specified line of code
- Event breakpoint — Pause during event processing such as click, timeout, interval, animation frame, etc.
- DOM breakpoint — Pause when DOM nodes are added, deleted or modified or attributes change.
- URL breakpoint — at
XMLHttpRequestorfetchPause before making request
Right-click the breakpoint and select Edit Breakpoint, configurable:
- Condition: Pause only when the expression is true.Supports Web Inspector Console API such as
$0(The DOM node is currently selected),$event(current event object) (11:31) - Ignore Count: Ignore the first N hits, suitable for in-loop debugging (11:52)
- Actions: Actions performed on hit, including:
- Evaluate JavaScript — Execute code in context (12:21)
- Log Message — Output logs using template strings (12:29)
- Play Sound — Play system sound (12:34)
- Probe Expression — Record changes in expression results in the Probe panel (12:38)
- Emulate User Gesture: Simulate user gestures when performing actions, bypassing API restrictions that require user interaction (such as auto-playing videos) (12:56)
- Auto-continue: Automatically continue after executing the action without pausing (13:20)
Practical debugging example - capturing only the click event of a specific button:
// Write this in the event breakpoint condition:
$event.target === $0  // Pause only on the element currently selected in the Elements panel
Key points:
- Conditional expressions support Console API, such as
$0、$event(15:55) - Actions support simulating user gestures to facilitate testing of restricted APIs (16:56)
- Multiple actions of the same type can be combined (17:12)
- Full configuration supported for all five breakpoint types (13:40)
Audit: Writing custom tests in Web Inspector
Audit is written in JavaScript and runs against the current page.You can inspect DOM structure, design system rules, Accessibility properties, and more (18:42).
Built-in test group:
- Demo Audit — Demonstrates how the Audit feature works (19:05)
- Accessibility — checks best practices against ARIA specifications, such as whether images have
altortitle(19:11)
Click the Edit button to enter edit mode (20:15):
// Custom Audit: check whether font families match the design system
function test() {
    const allowedFonts = ['ui-sans-serif', 'ui-serif', 'ui-monospace'];
    const offenders = [];

    for (const element of document.querySelectorAll('*')) {
        const fontFamily = getComputedStyle(element).fontFamily;
        const fonts = fontFamily.split(',').map(f => f.trim().replace(/['"]/g, ''));
        const isAllowed = fonts.some(f => allowedFonts.includes(f));
        if (!isAllowed) {
            offenders.push(element);
        }
    }

    return {
        passed: offenders.length === 0,
        details: offenders.map(el => ({
            node: el,
            message: `Unexpected font: ${getComputedStyle(el).fontFamily}`
        }))
    };
}
Test configuration items:
- Name/Description: Test name and description (21:04)
- Version: Minimum supported Audit version, prevents running in unsupported Web Inspector (21:07)
- Setup Script: Common setup code executed before each test (21:17)
- Test Function:return
true/falseor result object (21:32) - WebInspectorAudit API: Audit-specific API, see Web Inspector Reference (21:41) for details
Key points:
- The default Demo Audit and Accessibility tests cannot be edited, but can be copied and modified (20:27)
- Modifications are automatically saved without manual export and import (21:57)
- Failed nodes in the test results can jump to the Elements panel with one click (22:56)
- Audit can be exported as JSON to share with the team (25:27)
Core Takeaways
- Grid Overlay replaces manual calculation.When debugging Grid layout, first check the overlay to confirm the row and column positions, and then write CSS to reduce the number of trials and errors.
- Use Audit to solidify the design system rules.Write font, color, spacing and other specifications into Audit tests, and automatically check them before each submission to avoid “Comic Sans tragedy”.
- Event breakpoints + conditions to pinpoint problems.No need to insert it in the code
console.log, set a conditional click breakpoint and stop directly in the processing function of the target element. - Breakpoint actions simulate user gesture testing API.APIs that require user interaction to call (e.g.
navigator.share), you can use breakpoint actions to simulate gestures for quick verification. - Accessibility Audit as a release checklist.Before each release, run the built-in Accessibility test to ensure that the image has alt, the form has label and other basic compliance items.
Related Sessions
- Develop advanced web content — New JavaScript/WebAssembly features for Safari and WebKit
- Explore WKWebView additions — WKWebView latest updates
- Design for Safari 15 — Safari 15 Design Adaptation Guide
Comments
GitHub Issues · utterances