
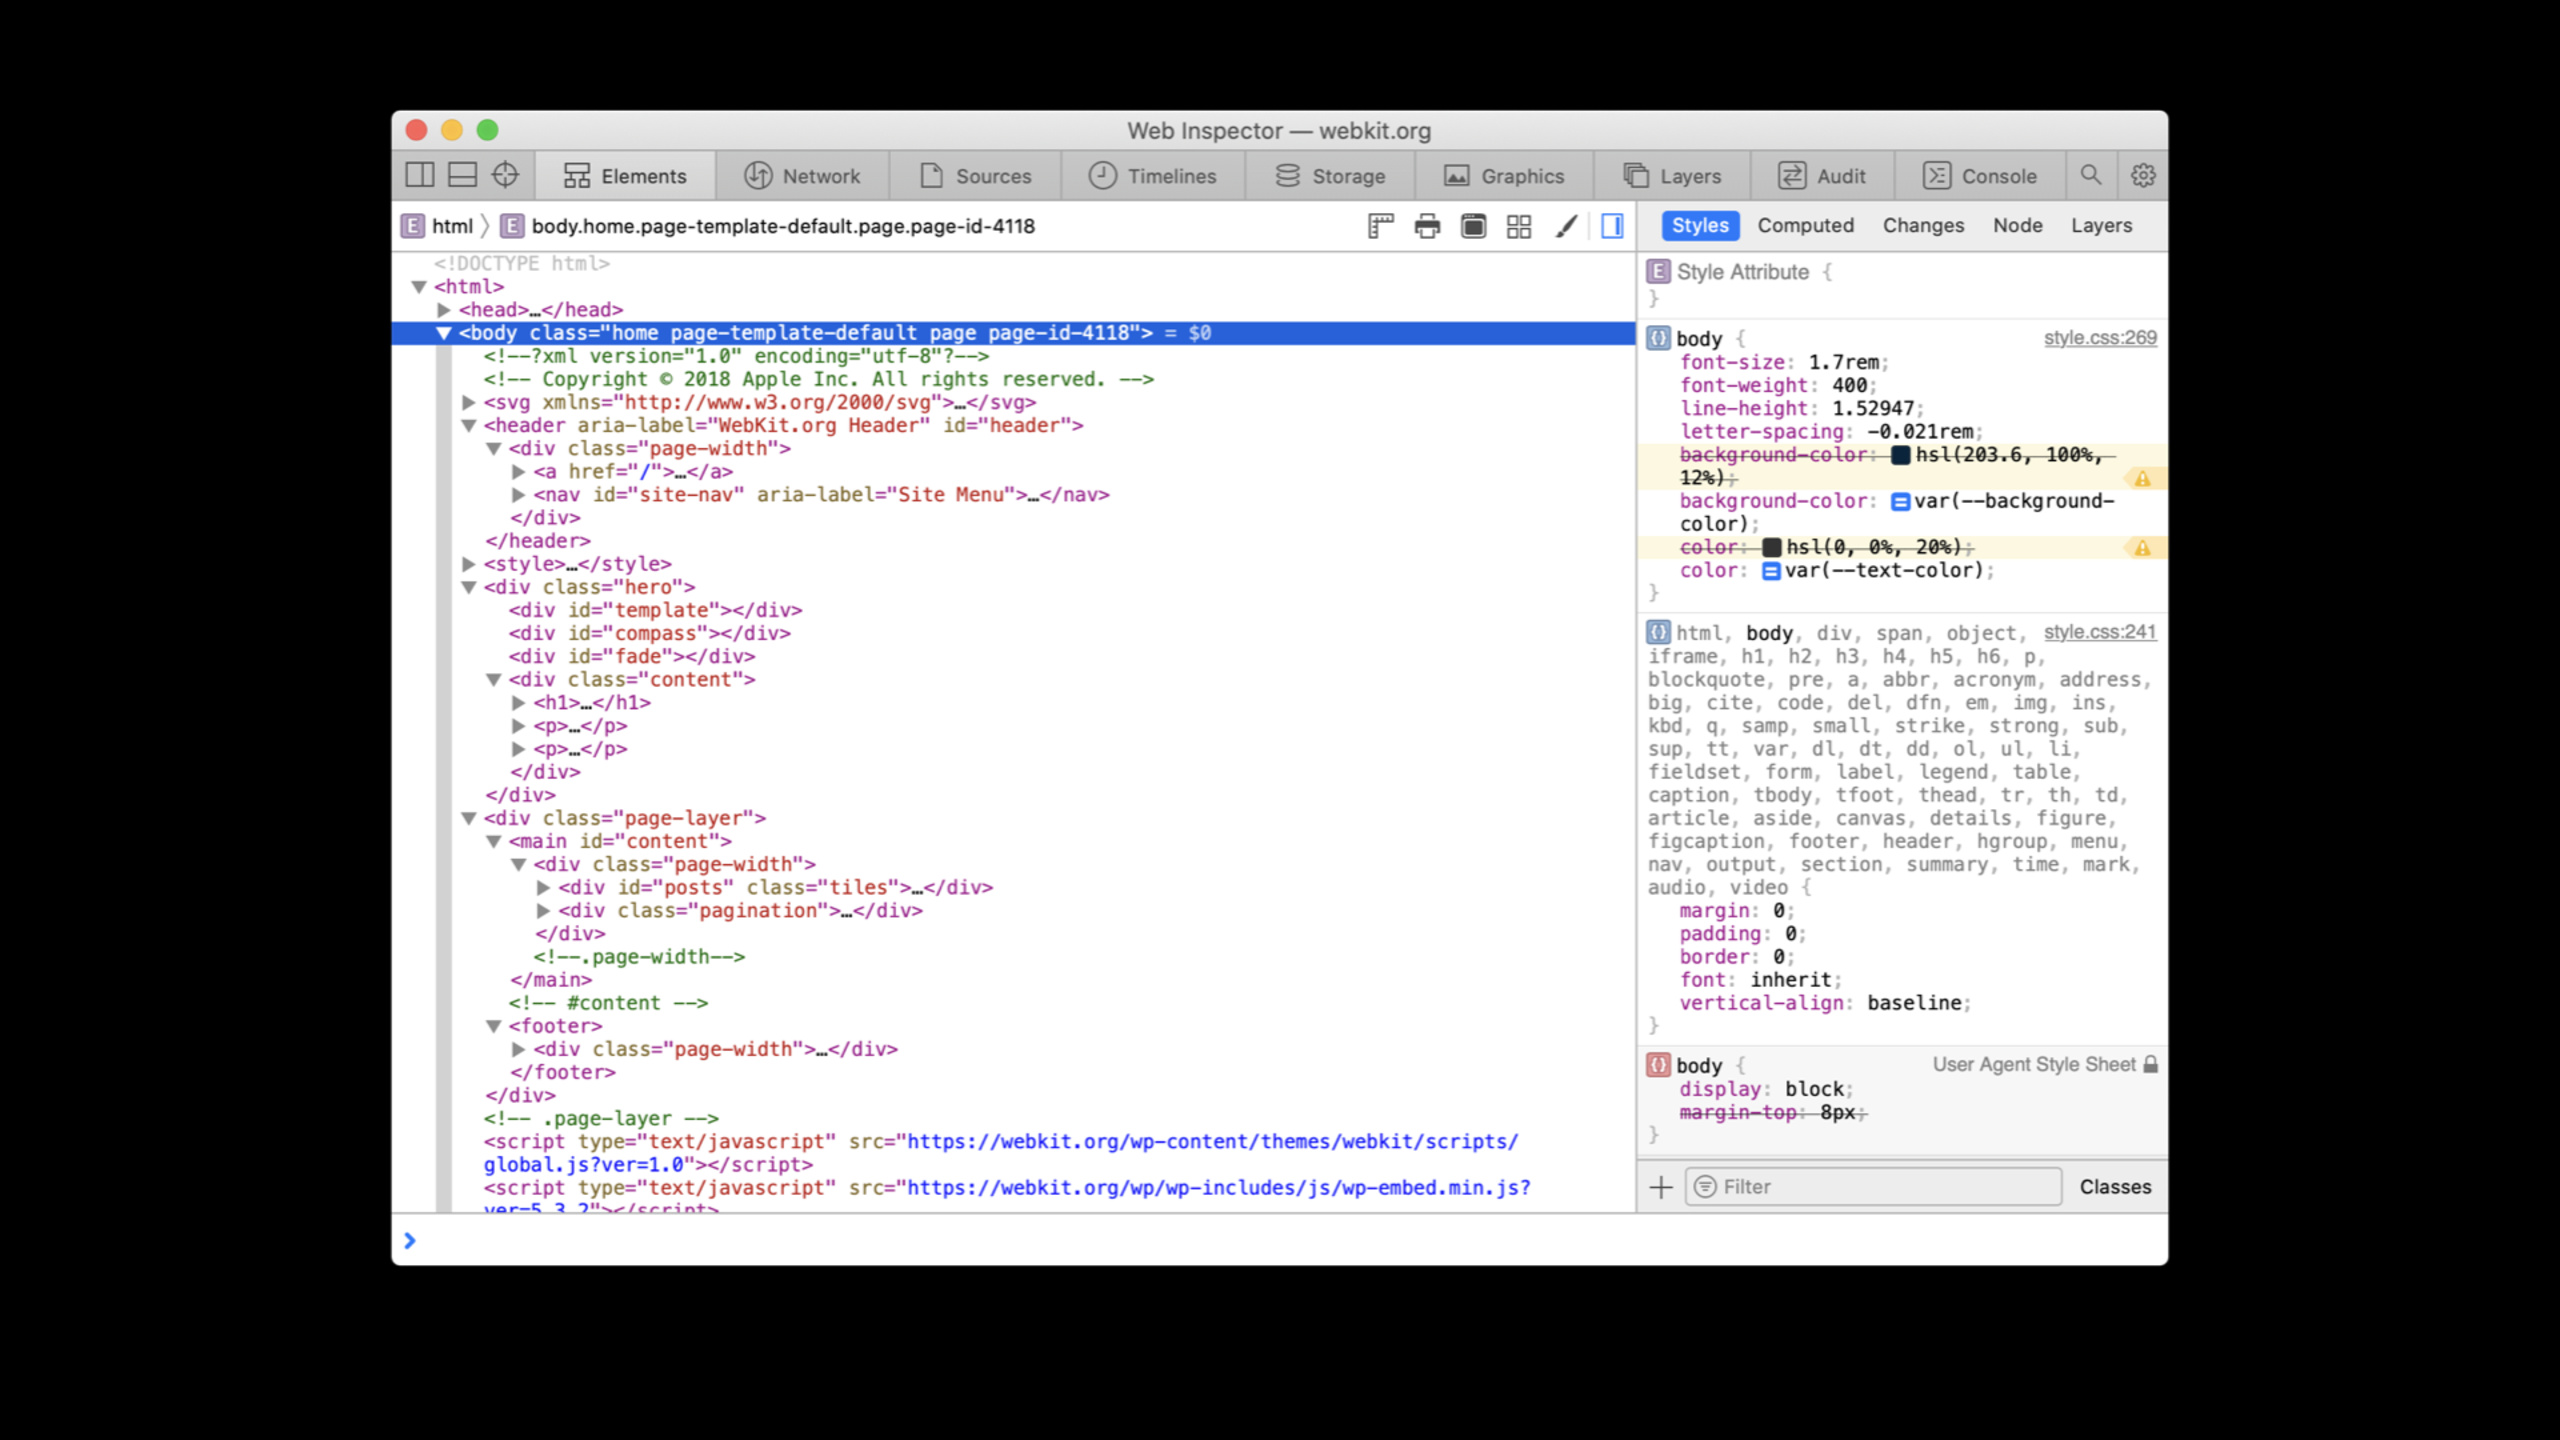
Highlight
Web Inspector in Safari 14 adds Sources Tab, Local Overrides, Inspector Bootstrap Script, Storage cookie editing, Media & Animations timeline, Graphics/Layers visualization, and Console heap query to help developers directly troubleshoot network, script, animation, and storage issues in Safari, WKWebView, and JSContext.
Core Content
When debugging web pages, problems are often scattered in several places. Resources come from the server, scripts are compressed into one line, third-party libraries block breakpoints, and animation lags are hidden in the rendering layer. In the past, to troubleshoot these problems in Safari, developers often had to switch back and forth between multiple tabs, change server files, restart the page, and observe again.
This session shows the changes to Web Inspector in Safari 14. The entrance is still in Safari’s Develop menu, and the ability covers Safari pages, WKWebView in Apps, and JSContext. Apple first compressed the interface height, merged the toolbar and dashboard into the tab bar, and then moved the Network statistics below the main table to reserve more vertical space when checking the page.
The more critical change is in the debugging path. The new Sources Tab brings together resource viewing, JavaScript debugging, and network coverage. When developers see problems with remote HTML, JSON, images or scripts, they can directly create Local Override, change the content, status code or HTTP header, and then refresh the page for verification. When you want to change the behavior of the JavaScript API exposed by WebKit to the page, use Inspector Bootstrap Script to run debugging logic in front of the page script.
The second half turns to specialized tools. Storage Tab supports filtering, editing, and deleting cookies. Timelines Tab Added Media & Animations timeline. Graphics Tab extends the original Canvas Tab and can see Web Animations, CSS animations, and CSS transitions. The Layers Tab allows developers to directly view the layer tree, memory cost, paint count, and the reason why a certain layer was created. Console also addedqueryInstancesandqueryHolders, used to find object instances and strong references directly from the JavaScript heap.
Detailed Content
Use Sources Tab to put resources, debugger and network overlay in the same path
(02:11) The Sources Tab merges the core capabilities of the old Resources Tab and Debugger Tab. It lists resources that have been loaded on the page since Web Inspector was opened, including long-lived WebSockets, as well as XHR andfetchThis type of short life cycle request. It is also the primary location for JavaScript debugger stepping controls, breakpoint entry points, and network overriding.
(03:08) When viewing resources, Web Inspector will provide alternate representations for appropriate content. HTML response can be switched to DOM tree, and JSON can be switched to object tree. The request body also has similar views. When troubleshooting interface responses, developers don’t have to just stare at the raw text and scroll to find labels or fields.
Key points:
- Sources Tab centralizes resource viewing, breakpoint debugging and network coverage in the same workspace.
- HTML response can be viewed by DOM tree, and JSON response can be viewed by Console object tree.
- These representations also apply to request content.
- Compared to the old experience, this reduces switching from the resource panel to the debugger and back to the network panel.
Use Local Overrides to replace remote responses locally
(04:26) Remote resources are often not easy to modify directly. It may be on the server, or it may undergo complex preprocessing. Local Overrides solves this link: when developers click Create Override when viewing any resource, Web Inspector will copy the current content into a local override version of the resource.
(05:43) Local Override not only changes the response body. Through the Edit Local Override operation, HTTP status code and HTTP headers can also be modified. When the page loads the resource matching the URL again, the entire response will be replaced by the local overwritten version, including content, status code, and headers. Overridden resources display special icons throughout Web Inspector.
Key points:
- Local Override persists across inspected pages and Web Inspector sessions.
- Main resources and non-text resources can also be overwritten, and the image explicitly mentioned in the transcript also applies.
- Replacement occurs when a URL is matched, covering response content, status code, and HTTP headers.
- This is suitable for fixes that the verification server is temporarily unable to publish, such as HTML copy, header configuration, or image replacement.
Use Inspector Bootstrap Script to rewrite the debugging environment in advance
(06:50) Some problems are not in the network resources, but in the JavaScript API surface that WebKit provides to the page. The Inspector Bootstrap Script is created from the add resource button at the bottom of the Sources Tab sidebar, and the content is guaranteed to run before any scripts in the inspected page.
This timing makes it suitable for two types of things. The first type is swizzle built-in functions, observing where the built-in functions are called. The second type is to set the global state in advance to allow the page’s own code to output more debugging information. Like Local Overrides, it persists across inspected pages and Web Inspector sessions.
Key points:
- Inspector Bootstrap Script modifies the JavaScript API surface seen when the page is started.
- It is guaranteed to run before other scripts on the page, suitable for inserting early probes.
- Uses given by transcript include swizzle built-in functions and setting global debug state.
- It is used for debugging without submitting temporary code to the website code base.
Avoid third-party library noise with new breakpoints and blackboxing
(07:54) Web Inspector adds multiple new global breakpoints. Debugger Statements breakpoint individually controlleddebuggerstatement, you don’t have to turn off all breakpoints in order to ignore it. All Microtasks will be paused before the microtask is executed, coveringPromiseandqueueMicrotask(). All Animation Frames, All Timeouts, All Intervals, and All Events are covered respectivelyrequestAnimationFrame、setTimeout、setIntervaland event listening callbacks.
(10:06) Global breakpoints are easy to stop in library code. The example of using jQuery to wrap event listening in Session illustrates this problem. Script blackboxing allows developers to mark a script as blackboxed, and the JavaScript debugger will delay the pause that originally occurred in the script to the first expression leaving the script. Large libraries can also use regular patterns to match multiple script URLs in the Settings Tab.
Key points:
debuggerstatement has an independent switch, and other breakpoint types can continue to work.- Microtask, animation frame, timeout, interval, and event listener all have global breakpoint entries.
- The goal of blackboxing is to stop breakpoints in developer code and reduce interference from third-party library wrappers.
- Web Inspector will still show call frames for blackboxed script, highlighted in gray.
Handle compressed or inline scripts with Step and HTML pretty print
(11:03) JavaScript may have multiple function calls strung together in a single line. In the past, developers had to Step In and Step Out multiple times if they wanted to stop before the third call. The new Step debugger action will pause again before the next expression of the current call frame. The example in Session is continuous executiona、bFinally, gradually arrive atccall.
(13:16) Inline scripting has also been improved. The latest version of Safari’s Web Inspector supports formatting HTML and other XML-like content, including inline scripts and style sheets. After Pretty print, existing JavaScript debugger and stepping capabilities can also be used for this inline content.
Key points:
- The granularity of Step action is expression, and the granularity of Step Over is statement.
- When there are multiple calls in a single line, Step can reduce the number of steps back and forth between Step In and Step Out.
- HTML pretty print makes inline scripts and stylesheets readable.
- Web Inspector will try to detect minified HTML and automatically turn on pretty printing.
Use Media & Animations, Graphics and Layers to check animation and rendering issues
(14:25) Timelines Tab Added Media & Animations timeline. It captures media element events, such as video pauses, and also captures the lifecycle of CSS animations and CSS transitions. Each media element, CSS animation or CSS transition has its own line with associated DOM node,animation-nameortransition-propertyinformation.
(17:54) Graphics Tab extends the original Canvas Tab. It still lists contexts and shaders, supports recording JavaScript API calls on context, and adds a new Web Animations list, categorized by sources such as JavaScript, CSS animations, CSS transitions, etc. When an animation is selected, the details sidebar displays the ID, associated nodes, timing parameters, keyframes, and backtrace when the JavaScript API creates the animation.
(20:02) Layers Tab displays the layer tree live view of the inspected page and lists the memory cost and paint count of each layer. After developers select a layer, they can see why it was created. The example in Session shows that the current layer comes from CSS animation and CSSwill-change property。
Key points:
- Media & Animations timeline is used to align media state, animation lifecycle and other timeline activities.
- Graphics Tab is suitable for checking the timing, keyframes and creation sources of Web Animations.
- Layers Tab is good for finding unintended layers, memory cost and paint count.
- The Layer tree view supports rotation, scaling and translation, making it easy to locate the target layer from the visual structure.
Use Storage and Console to directly handle state and heap objects
(16:19) The Storage Tab displays the data stored in the browser, including cookies, LocalStorage and IndexedDB. Safari 14’s Web Inspector adds filtering capabilities for various storage types and enhances cookie editing and deletion. Developers can double-click the cookie cell to open the popover and modify each field; they can also add cookies through the add cookie button, but the name is required.
(22:08) Console adds two new heap query functions worth remembering.queryInstancesReceives a constructor or prototype, scans the JavaScript heap for objects inherited from it, and returns an array.queryHoldersTakes an object and scans the heap for other objects that have strong references to it. For SessionPerson.parentNote that strong references may cause memory leaks.
(24:38) Privacy related logs also enter the Web Inspector Console. As long as Web Inspector is open and Intelligent Tracking Prevention Debug Mode is enabled in the Safari Develop menu, ITP debug logging will appear in both the Web Inspector Console and macOS Console.app. Ad Click Attribution Debug Mode logs will also be displayed in the Web Inspector Console.
Key points:
- The filter bar of the Storage Tab will match fields in the storage row such as cookies.
- Cookie editing is applied after popover dismissed, and a new cookie requires a name.
-
queryInstancesUsed to find the instance corresponding to a certain constructor or prototype. -queryHoldersUsed to find strong reference holders, suitable for troubleshooting JavaScript memory leaks. - The debug log of ITP and Ad Click Attribution can be viewed directly in the Web Inspector Console.
Core Takeaways
-
Make a remote response quick verification process: What to do: Prepare a set of Local Overrides checklist for online pages, covering HTML copy, images, HTTP headers and status code. Why it’s worth doing: Session explicitly states that Local Overrides can replace the complete response and retain it across sessions. How to start: Start building the override from the most frequently modified page resources, refresh the inspected page verification behavior, and then synchronize the confirmed changes to the server for implementation.
-
Make a third-party library breakpoint template: What to do: Configure blackboxing rules for commonly used libraries in the project to make it easier for global breakpoints such as All Events and All Timeouts to stop business code. Why it’s worth doing: The jQuery example of Session shows that event callbacks are often wrapped by library wrappers. How to start: Write a regular pattern for the library file URL in the Settings Tab, and then verify the pause position with a real click or timeout callback.
-
Make an animation performance troubleshooting panel: What to do: Organize the inspection steps of Media & Animations timeline, Graphics Tab and Layers Tab into a fixed process. Why it’s worth doing: Session provides animation life cycle, Web Animations parameters, layer memory cost, paint count and layer creation reason respectively. How to start: First record the timeline, then select the abnormal animation to view the keyframes, and finally go to the Layers Tab to check whether the relevant DOM node has any redundant layers.
-
Do a cookie and login status reproduction experiment: What to do: Use Storage Tab’s filtering, editing, and new cookie capabilities to reproduce login, A/B grouping, or area switch status. Why it’s worth doing: The Session Description cookie field can be edited directly, and new cookies will be like HTTP cookies or
document.cookieCookies that are set remain persistent. How to start: Filter the target cookie, record the fields before modification, refresh the page after modification and observe the Console and Network behavior. -
Make a small memory leak locating manual: What to do: put
queryInstancesandqueryHoldersJoin the front-end memory troubleshooting process. Why it’s worth doing: Session explains that they can directly scan the heap, find instances and strong reference holders respectively, and enter the target object faster than just looking at the complete heap snapshot. How to start: First use the constructor to find the instance in the Console, then call the holder query on the suspicious object, and return to the holder along the strong reference.
Related Sessions
- What’s new for web developers — Take a look at the Web API, CSS, media, and JavaScript updates for Safari and WebKit, then return to Web Inspector to debug these capabilities.
- Discover WKWebView enhancements — Web Inspector can inspect WKWebView, which adds new capabilities for embedded web content in apps.
- Meet Safari Web Extensions — Safari Web Extension development involves page scripts, extension logic and browser behavior, and is suitable for debugging with Web Inspector.
- Meet Face ID and Touch ID for the web — The registration and login process of the Web Authentication API can be observed through Web Inspector to observe script, network and Console behavior.
- What’s new in Universal Links — Universal Links connects websites and apps, and is suitable for understanding jump links together with Safari-side debugging tools.
Comments
GitHub Issues · utterances