
Highlight
Xcode 12 and Instruments expose Apple GPU’s performance limiters, memory bandwidth, occupation, HSR and other counters to the encoder and draw call levels, allowing Metal developers to trace specific resources and shaders from the longest pass.
Core Content
When a Metal game drops frames, it’s easy for developers to see “GPU busy” first. This is not enough. The real answer is: Which command encoder is the longest? Is it stuck on ALU, Texture Sampler, Buffer, Tile Memory, or Pixel Backend? Without GPU counters, optimization would be a matter of turning off effects, modifying the shader, re-running, and guessing again.
This session explains the troubleshooting sequence very clearly. First use the Game Performance template of Instruments to record a frame on the real device, open Performance Limiters and Shader Timeline, and find the encoder that takes the longest. Then pass the same frame to Xcode Metal Debugger, view the counters at the encoder or draw call granularity, and break down the “slowness” into specific hardware units.
These numbers must be read back into the Apple GPU’s TBDR (Tile Based Deferred Renderer, tile-based deferred rendering) architecture. Apple GPU does not have independent Video Memory. The CPU and GPU share System Memory. The GPU core relies on on-chip Tile Memory, ALU, Texture Unit, Pixel Backend and shared last level cache. Texture format, storage mode, load/store action, and draw order will all affect whether a frame is efficient.
The last demo of the speech is very representative. The team started from the Memory group of Xcode, sorted by Bytes Read From Main Memory, switched to Per-Draw Counters mode, and finally found a shared storage RGBA16 floating-point cube map in Bound Resources. After changing it to private storage, you can enable lossless texture compression; combined with block-compressed texture assets, the game can stably run to 120 FPS on iPad Pro.
Detailed Content
First locate the longest encoder from the tool chain
(04:33) Apple provides two entrances. Metal System Trace belongs to Instruments and is suitable for looking at the CPU/GPU timeline, system status and the time consumption of different encoders within the frame. Metal Debugger belongs to Xcode and is suitable for deeper performance investigations because it can list all GPU counters at the encoder granularity and can also display a large number of counters at the draw call granularity.
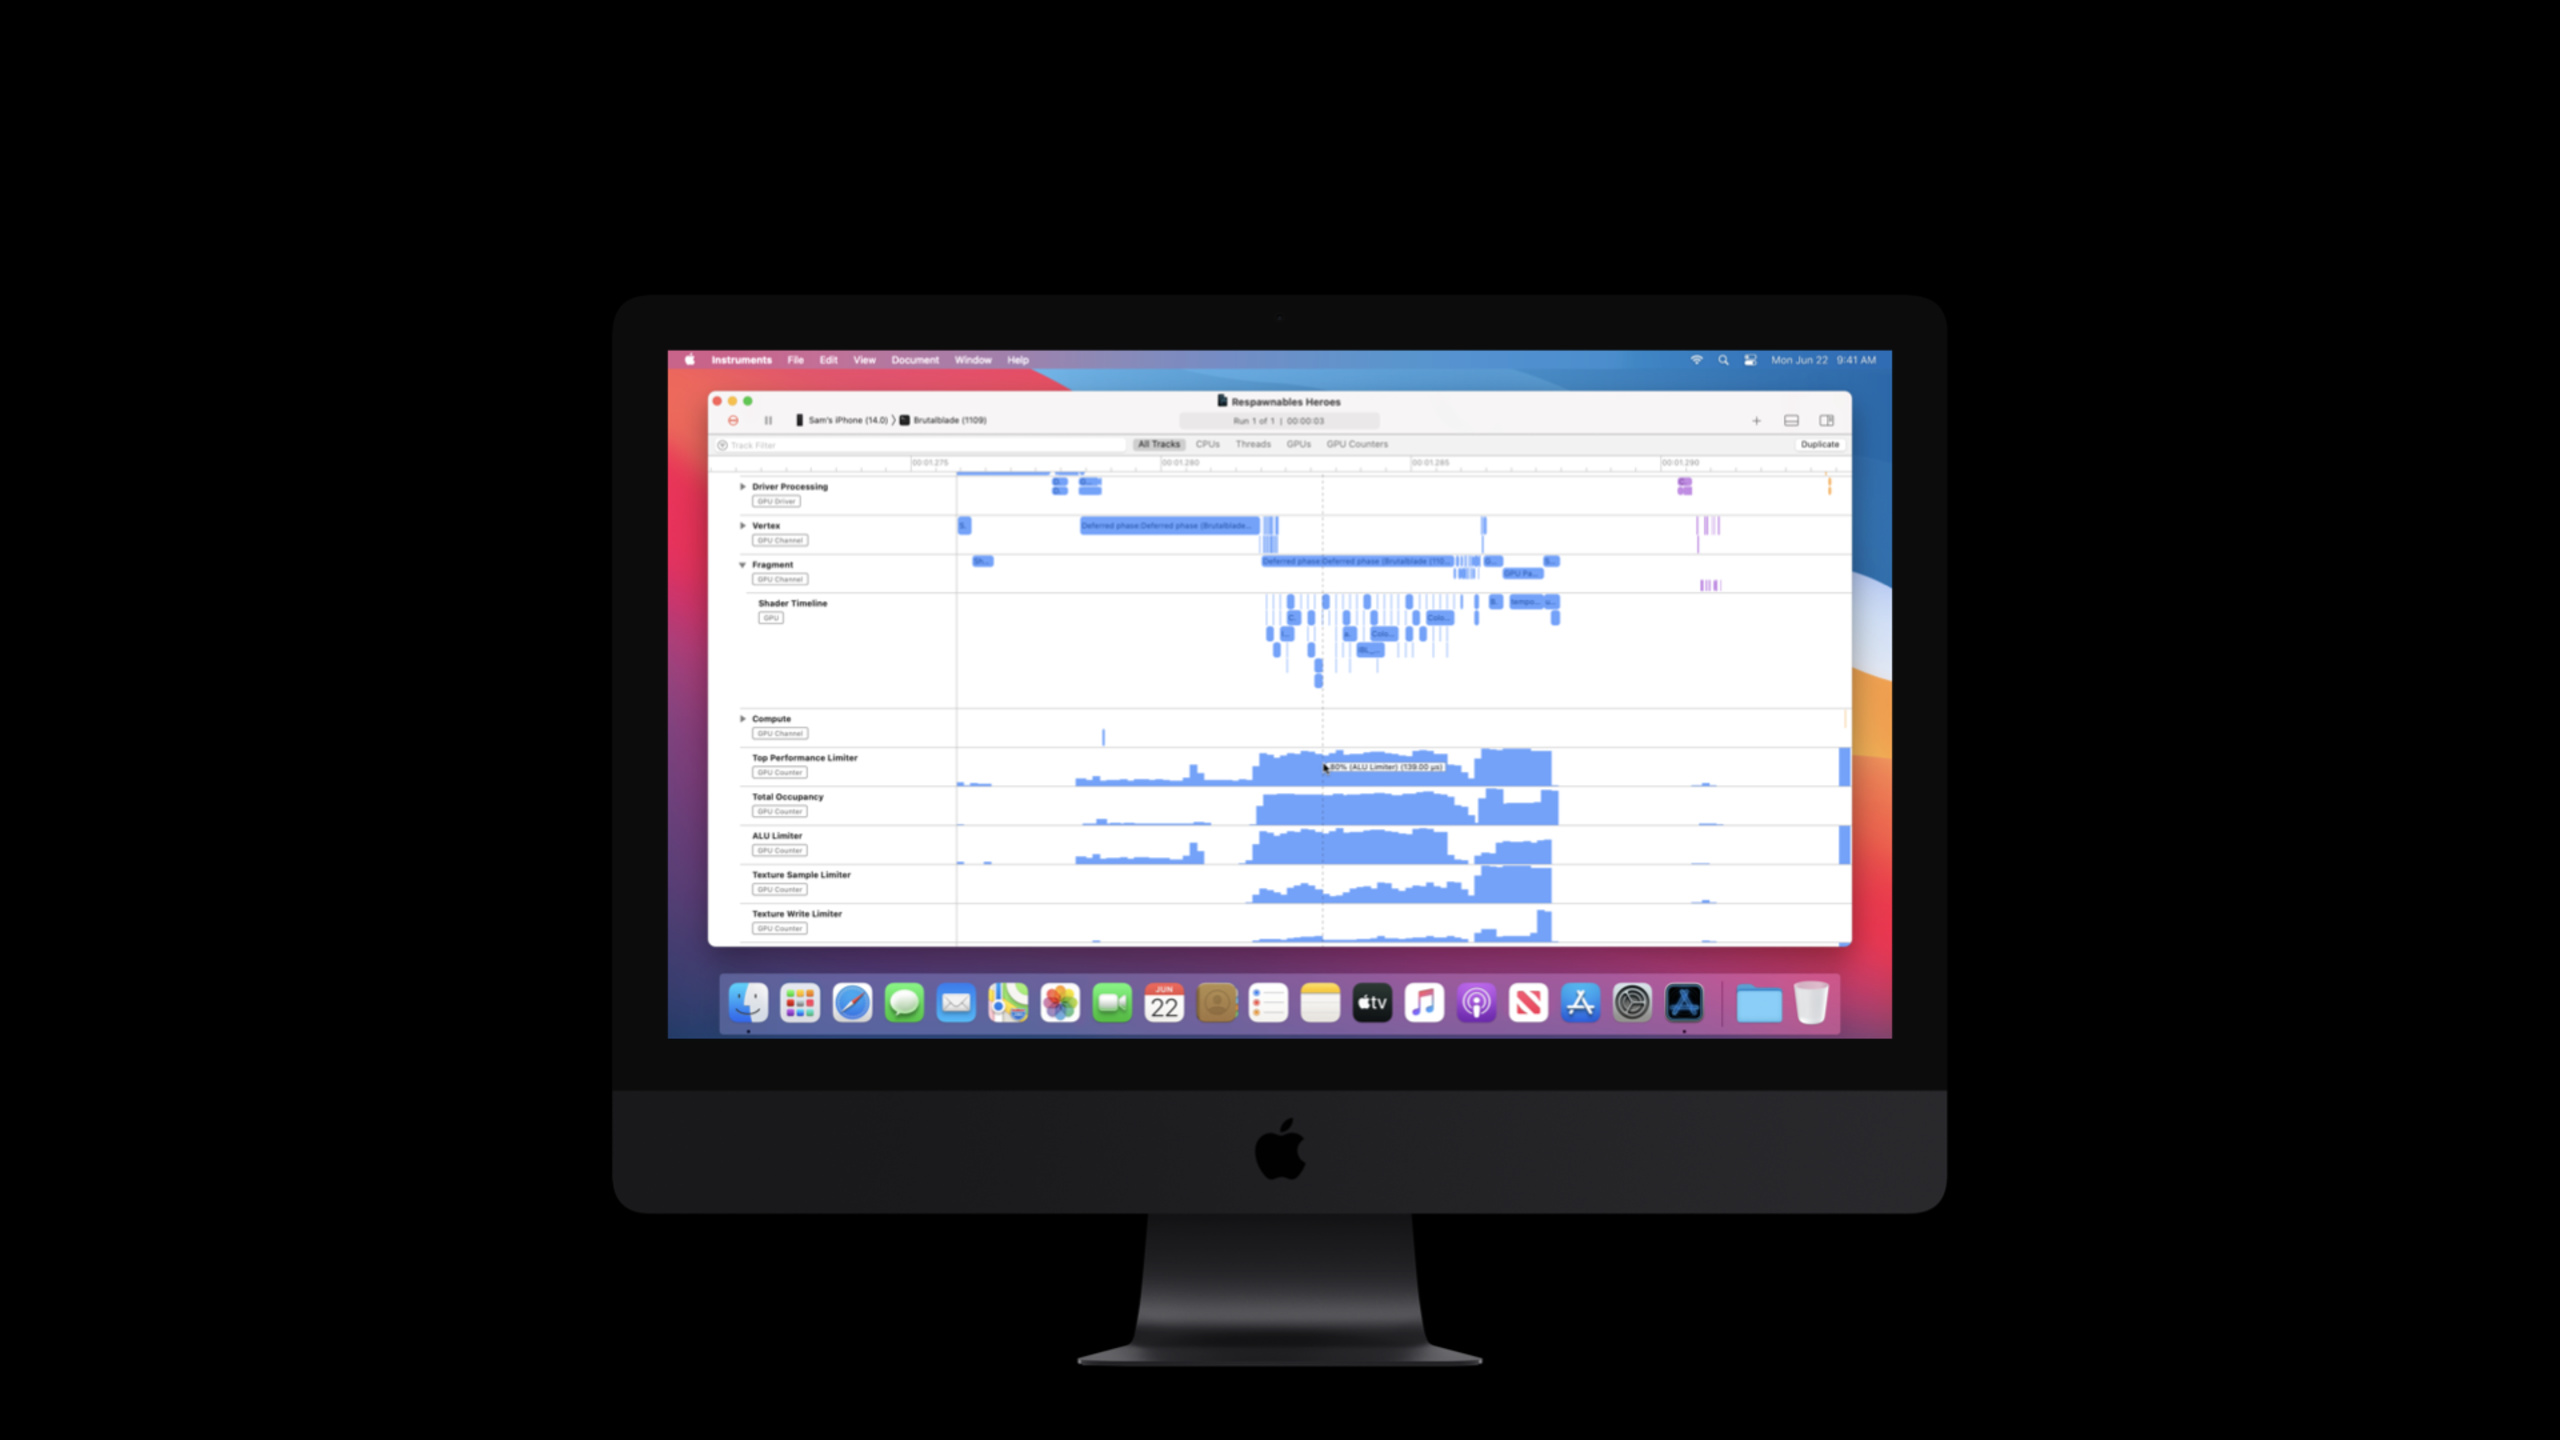
(06:58) The first step in the demo is to select the Game Performance template in Instruments, confirm the device and app, enter Metal Application recording options, set the GPU Counter Set to Performance Limiters, and enable the new Shader Timeline. After the recording is complete, developers can zoom to a frame and view the timeline of command buffers, encoders, and shaders.
Key points:
- Let’s look at the workload on the real device first, because the session clearly mentioned that Metal System Trace will be affected by thermals and dynamic system changes.
- Shader Timeline can show which shaders are running during the execution of an encoder, as well as the corresponding number of samples and approximate GPU time.
- The most worthy of digging in the demo is the Deferred Phase Encoder, because it takes the longest time within the frame, the fragment shader is about 1.29 ms.
- The top track of Performance Limiters will display the most prominent limiter currently, and there are separate tracks such as ALU and Texture Sampler below.
Performance Limiters Sort troubleshooting
(05:58) The GPU simultaneously performs arithmetic, memory access, rasterization and other tasks. The purpose of Limiter counters is to quantify the activity and stalls of multiple subsystems and indicate the “slowest part”. The speaker recommended always looking at performance limiters before deciding which set of counters to go into.
(10:00) The limiters covered by this session include Arithmetic, Texture Read and Write, Tile Memory Load and Store, Buffer Read and Write, GPU Last Level Cache and Fragment Input Interpolation. In Xcode, you can view by group, or you can use the filter to narrow the list by entering ALU, Texture, Buffer, Imageblock or Last Level Cache.
Key points:
- top limiter is not the final answer, it is just the entrance to the next step of investigation.
- Instruments is suitable for finding “Which paragraph is the longest”, and Xcode is suitable for answering “Why is this paragraph long”.
- Xcode’s counters table can be sorted, and the demo uses it to find the most expensive encoder and the most ALU-limited encoder.
- When the average judgment of an encoder is not enough, you can switch to Per-Draw Counters mode to reduce the problem to specific draw calls.
ALU limiter: Check precision, complex operations and branch consistency
(10:22) The ALU is part of the shader core and handles floating-point arithmetic, integer arithmetic, bit-wise operation and relational operation. On Apple GPUs, 16-bit floating point runs at double rate, 32-bit floating point runs at full rate, and 32-bit integer and complex operations usually run at half rate or lower.
(11:19) The SIMD lane of the shader core has 32 threads, but shares a program counter. When all threads execute the same instruction, it belongs to coherent execution. When a conditional branch allows some threads to take another path, it is divergent execution; the same program in the demo diagram changes from 40 cycles to 70 cycles because threads that have not entered the branch still consume cycles.
Key points:
- If the ALU limiter is high, first check to see if it is the expected bottleneck; GPU crunching numbers are not a bad thing in themselves.
- When wanting to reduce ALU load, session recommends replacing complex calculations with approximations or lookup tables.
- Reduce full precision floats when using half precision to avoid implicit conversions and FP32 textures/buffers input.
- Confirm Metal shaders are used when the project allows
-ffast-mathCompile options. - A high ALU limiter does not mean that the shader is efficient; the speaker gave an example that when it is all FP32 operation, it may be 100% ALU limited, but the utilization is only 50%.
Texture and bandwidth: Check from format, compression, storage mode
(14:25) The Texture Processing Unit (TPU, texture processing unit) is responsible for reading texture data. It is used for LoadActionLoad of render pass, and is also used to explicitly read or sample texture in shader. Pixel format will directly affect the sampling rate. In the speech, 128-bit formats such as RGBA32Float were specifically named because they are sampled at the quarter rate.
(15:10) Apple GPU supports block-compressed pixel formats such as PVRTC and ASTC, and also supports lossless compression of conventional pixel formats. A13 GPU supports ASTC HDR; the HDR environment map example in the speech shows that an uncompressed small cube map requires 3 MB, and ASTC HDR can significantly reduce memory footprint and bandwidth.
(29:50) Xcode demo shows the complete troubleshooting link: switch to the Memory group, sort by Bytes Read From Main Memory, confirm that the Deferred Phase encoder reads the most memory; switch to Per-Draw Counters mode, only look at the draw calls in the encoder; then press texture L1 bytes transferred Sort, enter Bound Resources, and find that the draw call binds and reads the RGBA16 floating-point cube map of shared storage.
Key points:
- When Texture Sample limiter is high, mipmaps, filtering options, anisotropic sample count, pixel size and texture compression are checked first.
- When the Texture Write limiter is high, check the pixel size, unique MSAA samples per pixel, and whether the write is coherent.
- The sampled texture of shared storage cannot automatically use lossless texture compression; the demo recommends changing to private storage.
- When private storage is not available, Blit Command Encoder can be used to explicitly optimize resources for the GPU.
- Memory Bandwidth counter measures the data transfer from System Memory to GPU; if the texture or buffer limiter is both high, the corresponding resources must be optimized first.
Tile Memory, Buffer, GPU LLC: Put data at the appropriate level
(17:34) Tile Memory is a high-performance memory used to store Threadgroup and Imageblock data. It appears in scenarios such as tile shaders, threadgroup memory, render pass color attachments, programmable blending and normal blending. Tile Memory is often shown as Imageblock or Threadgroup Memory in tools and documentation.
Key points:
- When Tile Memory limiter is high, session is recommended to reduce threadgroup atomics.
- Consider threadgroup parallel reductions or SIMD lane operations when the algorithm allows.
- Threadgroup memory allocations and accesses should be aligned to 16 bytes.
- The memory access pattern itself also affects efficiency, which can be improved by rearranging the access order.
(18:52) Metal buffers are also backed by Device Memory, but are only accessed by Shader Core. Buffer data has two address spaces: device and constant: device is suitable for data accessed by fragment or vertex index; constant is suitable for read-only data used jointly by many vertices or fragments.
Key points:
- When the Buffer limiter is high, first check whether the data can be packed tighter.
- Use smaller types to reduce unnecessary data width.
- Try to vectorize load and store.
- Avoid device atomic and register spills.
- In some scenarios, the data can be changed to texture to take advantage of the different caches of ALU and TPU.
(20:08) GPU Last Level Cache (GPU LLC) is shared by all GPU cores, caches texture and buffer data, and also stores device atomics. It is optimized for spatial locality and temporal locality. It is recommended to use Tile Memory first instead of putting too much pressure on the GPU LLC; if the texture or buffer limiters are both high at the same time, the texture or buffer should be processed first.
Occupancy and HSR must be read jointly with other counters
(23:24) Occupancy measures how much thread capacity the GPU is currently using. The GPU hides latency by switching available threads, provided that internal resources are sufficient and there are commands to schedule. Speakers emphasized that neither high occupancy nor low occupancy is a problem in itself.
Key points:
- Developers should query the static properties of the compute or rendering pipeline, including maximum number of threads per threadgroup, SIMD lane execution width, and static threadgroup memory length.
- Low Vertex Occupancy is acceptable as long as there is sufficient Fragment Occupancy.
- Low overall occupancy may come from exhaustion of internal resources such as tile/threadgroup memory, or it may simply be that the render area is too small or the compute grids are too small.
- Occupancy should be judged together with ALU, Texture, Buffer, Bandwidth and other counters.
(25:54) HSR (Hidden Surface Removal, hidden surface removal) is an early visibility pass, used to reduce overdraw. It is pixel perfect for opaque meshes and submission order independent. Session defines overdraw with a measurable metric: the ratio of Fragment Shader invocations to Pixels Stored.
Key points:
- The efficiency of HSR can be measured by counters such as pixels rasterized, Fragment Shader invocations, pixels stored and Pre-Z test fails.
- Reduce full-screen passes and blending when reducing overdraw.
- The draw order should be sorted by visibility state: opaque meshes first, then alpha test, discard, depth feedback, and finally translucent meshes.
- Avoid staggering opaque and non-opaque meshes.
- Avoid interleaving color attachment write masks with different opaque meshes.
Core Takeaways
-
What to do: Built a “Performance Scenario” menu into the game, and fixedly jumps to reproducible scenes such as battles, main cities, and post-processing stress tests.
-
Why it’s worth doing: The session workflow starts with a real frame, and fixed scenes allow Instruments and Xcode to capture comparable counters.
-
How to start: Add debugging entrance for each scene, record Metal System Trace, first compare the top performance limiter and the longest encoder.
-
What to do: Add a “Texture Bandwidth Audit” report to the material system.
-
Why it’s worth doing: The demo finds the RGBA16 floating-point cube map of shared storage through per-draw counters, and recommends changing it to private storage or block compression.
-
How to start: Scan the pixel format, mipmap, storageMode and compression status of the texture, and mark RGBA32Float, no mipmap, and shared sampled texture as high priority check items.
-
What: Add half precision and divergent branch checks to shader review.
-
Why is it worth doing: The session clearly states that F16 is a double rate, and divergent execution will cost the same SIMD lane extra cycles.
-
How to start: Starting with the encoder with the highest ALU limiter, review FP32 inputs, complex functions, implicit conversions, and data-dependent branches in the fragment shader.
-
What to do: Establish stable draw order strategies for transparent objects, alpha test, and opaque mesh.
-
Why is it worth doing: HSR counters can measure overdraw; session is recommended to use opaque first, then alpha/discard/depth feedback, and finally translucent.
-
How to start: Bucket by visibility state in the renderer’s render queue, and then use the ratio of Fragment Shader invocations to Pixels Stored to verify the changes.
Related Sessions
- Harness Apple GPUs with Metal — Complete architectural background such as TBDR, tile memory, render pass, etc.
- Bring your Metal app to Apple silicon Macs — Explain the key points of GPU architecture migration on Apple silicon Macs.
- Optimize Metal Performance for Apple silicon Macs — Continue to talk about the performance tuning of Metal workload on Apple silicon Macs.
- Gain insights into your Metal app with Xcode 12 — Introducing debugging tools in Xcode 12 for understanding Metal app behavior.
Comments
GitHub Issues · utterances