
Highlight
Provided by Apple
CI_PRINT_TREEEnvironment variables allow Core Image developers to output each rendered graph as text, PDF, or PNG to locate color space conversion, intermediate buffering, ROI, time-consuming, and memory issues.
Core Content
The output of Core Image often looks like an image, but inside it is a deferred execution recipe.Developers create filters, set inputs, and getoutputImageAt the time, a lot of the work wasn’t actually rendered yet.When the problem lies in color management, optimization reflow, GPU pass or cache hit, it is difficult to tell which step changed the result just by looking at the final image.
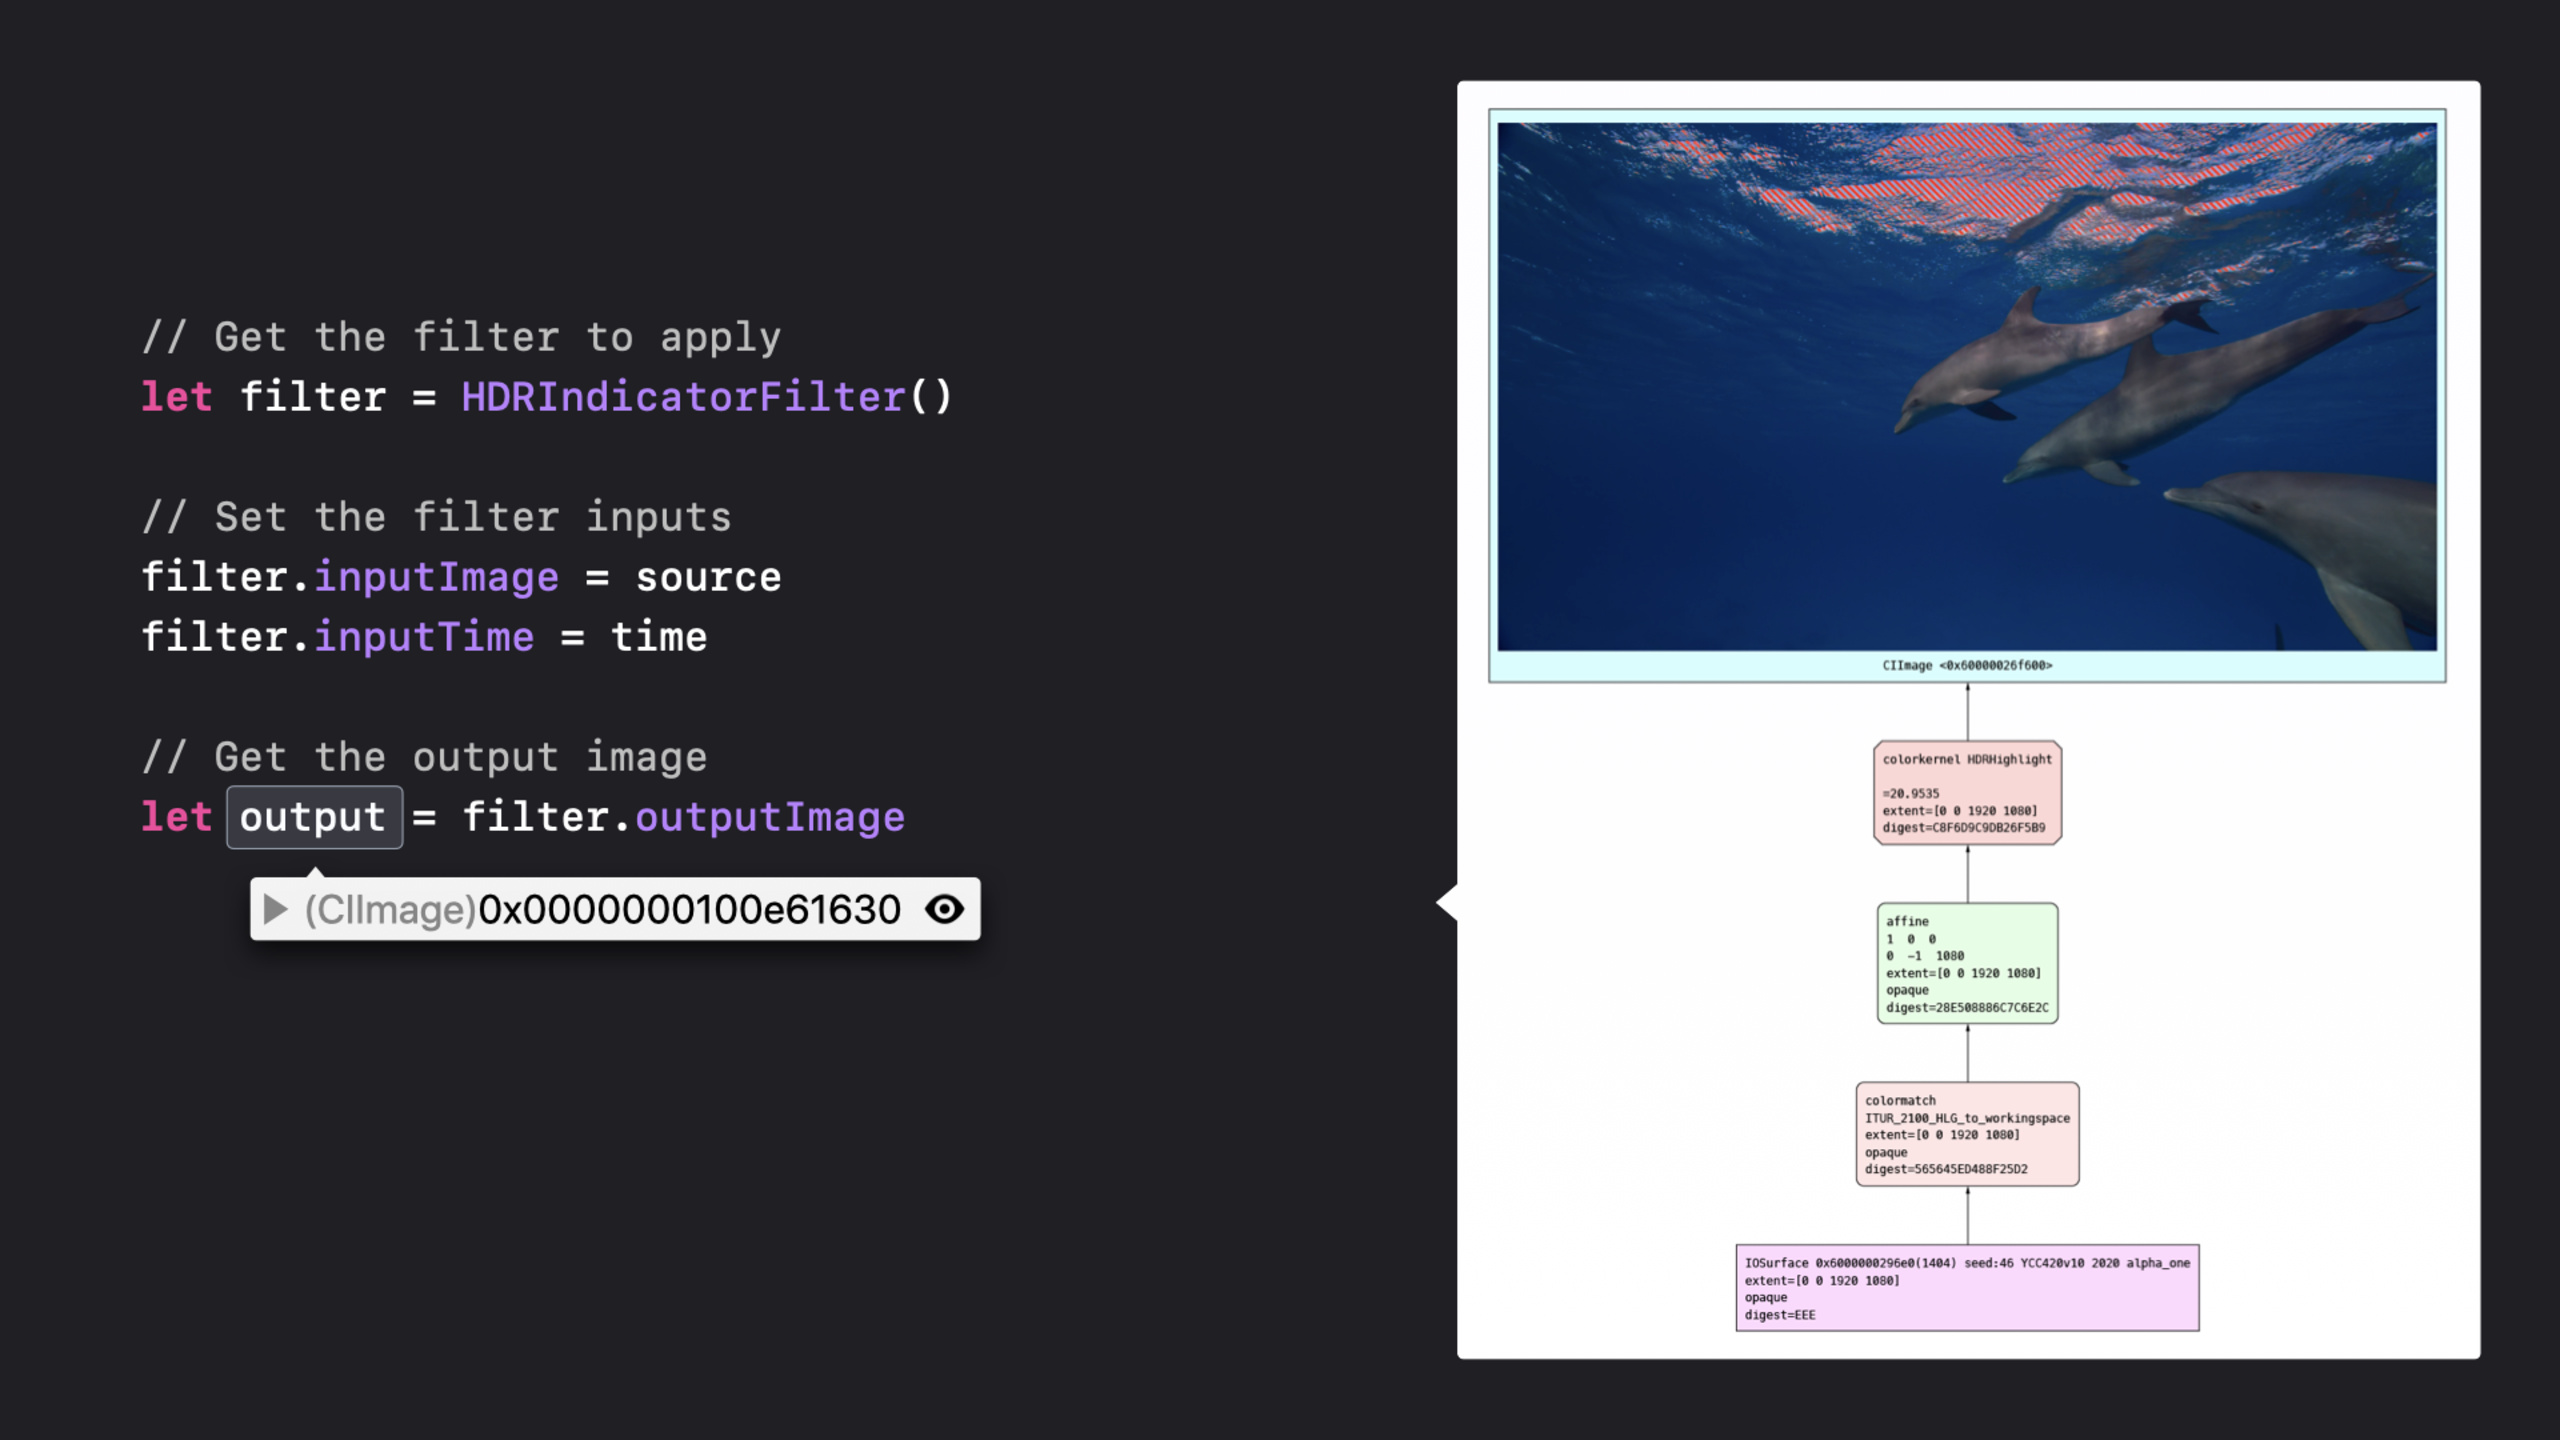
This session focuses on one tool:CI_PRINT_TREE.It’s based on the same infrastructure used by Core Image Quick Look in Xcode.Click while debuggingCIImageWith the eye icon next to it, you can see the visual recipe that generated this image; after turning on the environment variable, the Core Image graph can be automatically output every time you render.
The value of this graph is to spread out the hidden pipelines.You can see the initial tree to confirm the color space, the optimized tree to see how Core Image rearranges, merges, and clips nodes, and you can also see how many intermediate buffers are needed after connecting to the GPU program.For photo, video, and visual effects apps, this is more straightforward than staring at the final frame and guessing why.
Detailed Content
1. Open CI_PRINT_TREE in Xcode or Terminal (01:41)
CI_PRINT_TREEis an environment variable.Session provides two ways to open it: add environment variables in the Arguments panel of the Xcode target scheme, or set it in Terminal and then start the App executable.
CI_PRINT_TREE=1 /path/to/AppExecutableKey points:
CI_PRINT_TREEThe value controls which graph Core Image outputs.1Corresponding to the initial state of each image render, it is suitable to check the input and color space first.- This variable only affects debug output and does not change Core Image’s filter algorithm.
2. Use 1, 2, 4, 7 to select the graph stage (02:26)
Core Image render has three observable phases.type1is the initial state, type2is the optimized render, type4It is the result of Core Image concatenating stages into a GPU program.session explicitly mentions that these values can be combined,7will be output simultaneously1、2and4。
CI_PRINT_TREE=1   # initial render tree
CI_PRINT_TREE=2   # optimized render tree
CI_PRINT_TREE=4   # concatenated GPU-program tree
CI_PRINT_TREE=7   # 1 + 2 + 4
Key points:
1Used to confirm the status of each image and node when render starts.2Used to observe how Core Image reorders, combines and prunes the render phase.4Used to view the intermediate buffer required after Core Image is connected to the GPU program.7It is suitable for completely troubleshooting a complex render, but the output volume will increase.
3. Select PDF, PNG, text or oslog output (03:13)
The output type can be PDF or PNG.When you specify these types, Core Image saves the graph document for each render.macOS will write to the temporary items directory; iOS will write to the Documents directory first and fall back to the temporary directory if it fails.When no output type is specified, Core Image will output compact text to standard out.
export CI_LOG_FILE="oslog"Key points:
CI_LOG_FILE="oslog"The text output will be sent to Console.app, which is more convenient for iOS debugging.- PDF or PNG suitable for analyzing node structure, color conversion and intermediate results.
- text output is good for quickly seeing if render is firing and if the graph is being generated as expected.
4. Use context, frame and intermediate images to narrow down the scope of investigation (03:52)
Complex apps may have multipleCIContext, the video App will also render many frames continuously.session mentionedcontext==nameYou can only record the context with the specified name,frame-numberYou can only record the nth render of each context.There are also options to write input images, intermediate images, and output images together into the document.
context==name
frame-number
dump-intermediates
Key points:
context==nameUsed to filter a certain namedCIContext。frame-numberUsed to capture the specified render times, suitable for video or real-time preview.dump-intermediateswith type4When combined, the intermediate buffer of each pass except the output pass can be displayed.- Documents with images will increase generation time and memory, and session explicitly requires careful use.
5. Read color, ROI, cache and resource pressure from the graph (05:24)
The reading direction of CI_PRINT_TREE document is bottom input and top output.Green nodes represent the warp kernel, and red nodes represent the color kernel.Can be found in the initial treecolormatchnode to confirm whether the input image is transferred from HLG colorspace to Core Image linear working space.
input images: bottom
output image: top
green nodes: warp kernels
red nodes: color kernels
ROI: region of interest
Key points:
colormatchThe node can expose color space conversion, suitable for troubleshooting HDR or video color inconsistencies.- Each node displays ROI (region of interest), indicating which area of the node is needed for this render.
- If an intermediate image does not appear in the tree, Core Image may reuse the cache from an earlier render.
- The document can also display the execution time, pixel count and pixel format of each pass, which can be used to determine the period in which time and memory consumption are concentrated.
Core Takeaways
Core Image debugging switch
What to do: Add a Core Image graph export switch to the Debug build.
Why it’s worth doing:CI_PRINT_TREEThe render’s initial tree, optimization tree, and GPU program tree can be output into a readable document, so the team does not have to guess the source of errors based on the final image alone.
How to start: First add it in Xcode schemeCI_PRINT_TREE=1, confirm the output path and file permissions, and then switch to7Capture the complete graph.
HDR Color Pipeline Audit
What to do: Do a color space troubleshooting process for your photo or video editing app.
Why it’s worth doing: session shows passingcolormatchThe node views the conversion from HLG to Core Image linear working space, and color issues can be located directly in the graph.
How to start: Grab type1The initial tree of , findcolormatchNode and colorspace names, record input material, workspace and output configuration to the same debug report.
Video frame performance sampling
What to do: Add performance samples captured by frame to the real-time filter preview.
Why it’s worth doing:frame-numberYou can only record the specified render; the document includes execution time, pixel count and pixel format, which can indicate the most time-consuming or memory-consuming pass.
How to start: Use firstframe-numberFix the exception frame once and use type again4anddump-intermediatesLook at the intermediate buffer, and finally reproduce the same frame against the UI operation.
iOS device on-site diagnostics
What to do: Prepare a process for retrieving the Core Image graph for iOS debug builds.
Why is it worth doing: session description iOS will write the document into the Documents directory or temporary directory.CI_LOG_FILE="oslog"Text logs can also be sent to Console.app.
How to start: Turn on iTunes file sharing, drag the graph document from the Files panel of Finder back to Mac; use Console.app on the log side to filter by process.
Related Sessions
- Optimize the Core Image pipeline for your video app — Talk about the memory, playback view and Metal command queue optimization of the Core Image video pipeline, suitable for viewing together with the performance analysis of CI_PRINT_TREE.
- Build Metal-based Core Image kernels with Xcode — Expand
.ci.metalkernel integration and loading, which is suitable for troubleshooting graphs of customized Core Image kernels. - Gain insights into your Metal app with Xcode 12 — Introducing Xcode 12’s Metal debugging and performance tools to complement the GPU-level graphics problem location.
- Optimize Metal apps and games with GPU counters — Demonstrates how to collect and interpret GPU counters, suitable for continuing to analyze the Metal workload behind Core Image.
Comments
GitHub Issues · utterances