
Highlight
iOS 13 introduces MetricKit, which allows developers to collect aggregated performance metrics from user devices.But there was only MXMetricPayload at that time. You could see exceptions in the hang duration histogram or hang for a long time, but you didn’t know the root cause.iOS 14 adds MXDiagnosticPayload, which brings crash diagnostics and hang diagnostics. Each diagnosis contains complete call stack information.
Core Content
MetricKit’s positioning is clear: it fills in the gap where developers can’t see real user devices.After the app enters TestFlight or the App Store, you usually can’t get the device in the user’s hand, and you can’t let the user open Instruments.MetricKit passively collects power and performance data on the device, aggregates it into a payload every 24 hours, and then hands the anonymous data to the App.
MetricKit in iOS 13 can already answer “Is this version slower?”It gives aggregated indicators such as startup time, CPU time, memory, etc., and is suitable for build-to-build trend comparisons.The problem is that aggregated metrics can only point out symptoms.For example, if the number of cold starts increases abnormally, or if a long-term hang appears in the hang duration histogram, you still lack the root cause.
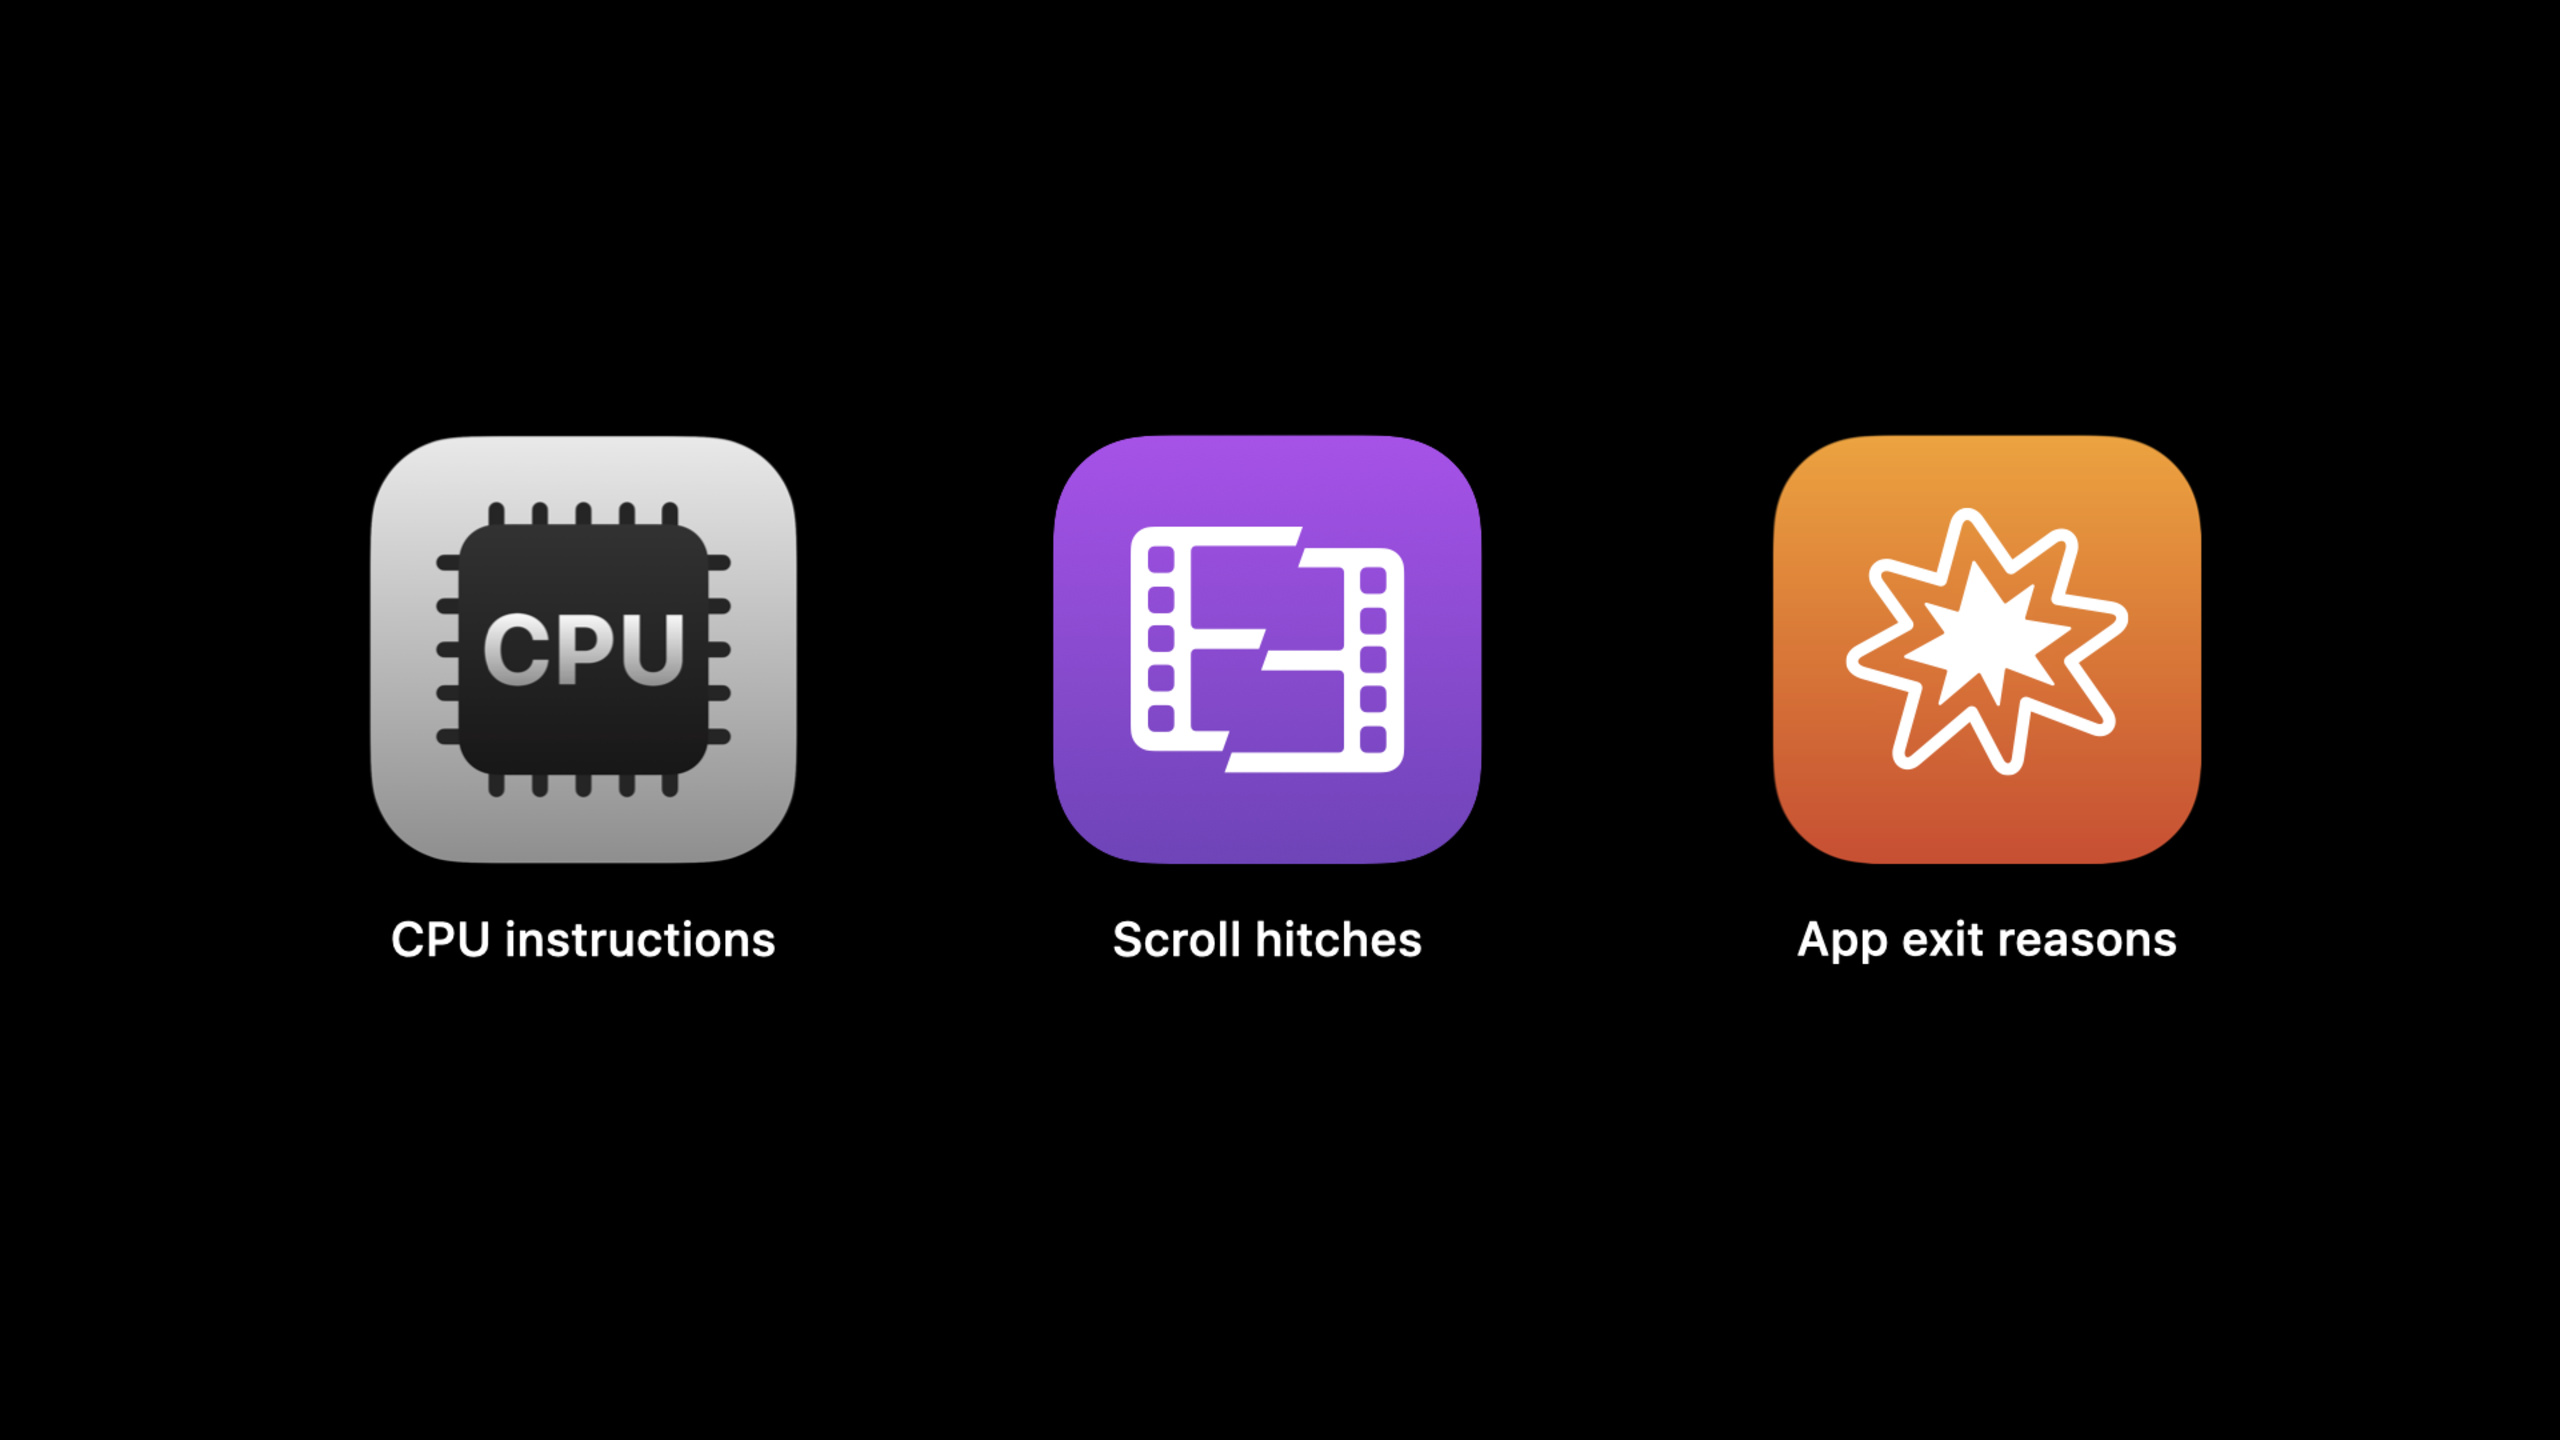
MetricKit 2.0 for iOS 14 extends in both directions.The first is the new metrics: CPU instructions, scroll hits, and application exits.They allow developers to more accurately measure workload, scrolling smoothness, and exit reasons.The second is to add new diagnostics: hang, CPU exception, disk write exception, crash.The diagnostic payload and metric payload are delivered on the same day, and developers can put the trend and call stack in the same troubleshooting link.
The core value of this session is not to have a few more indicator names.It advances online performance issues from “seeing abnormal curves” to “getting enough positioning information.”MetricKit is still a delayed, aggregated, privacy-preserving data source, but it begins to provide call stack trees, exception causes, and diagnostic metadata that are sufficient to support post-release performance regression triage.
Detailed Content
Accessing MetricKit is still a subscription model
(02:11) The basic access process of MetricKit has not changed.App link and importMetricKit,createMXMetricManager.shared, making the custom object comply withMXMetricManagerSubscriber, and then implement the method of receiving metric payload.
import MetricKit

class MySubscriber: NSObject, MXMetricManagerSubscriber {

    var metricManager: MXMetricManager?

    override init() {
        super.init()
        metricManager = MXMetricManager.shared
        metricManager?.add(self)
    }

    override deinit() {
        metricManager?.remove(self)
    }

    func didReceive(_ payload: [MXMetricPayload]) {
        for metricPayload in payload {
            // Do something with metricPayload.
        }
    }

}
Key points:
MXMetricManager.sharedIt is the entrance for the app to interact with the MetricKit framework.metricManager?.add(self)Start subscribing to the metric payload aggregated by the system.metricManager?.remove(self)Unsubscribe when the object is released to prevent the manager from holding invalid subscribers.didReceive(_ payload: [MXMetricPayload])Receives an array of performance metrics aggregated by day.- The transcript clearly states that the payload is anonymous data to protect user privacy.
New metrics to supplement workload, fluency and exit reasons
(05:21)MXCPUMetricAdded CPU instructions.It counts the accumulated retired instructions of the App every day.CPU time will be affected by clock frequency. CPU instructions are hardware- and frequency-independent workload indicators and are more suitable for judging whether a change really makes the CPU work more.
(05:48) scroll hits are geared toward graphics performance.Session defines hitch as a frame that does not appear on the screen at the expected time when scrolling. The result that the user sees is that the animation is not smooth.MetricKit provides apps inUIScrollViewThe proportion of time the hitch occurs during scrolling.
(06:28) application exits gives a daily summary of foreground and background exit reasons.It not only counts “how many times you exited”, but also breaks it down by reason and number of times.Apple specifically notes that this type of data can help troubleshoot startup issues and common termination issues encountered when using background running frameworks.
Key points:
- CPU instructions are used to measure how much actual work the app does on the CPU.
- scroll hitsches turn scroll hitches into online aggregable proportional indicators.
- application exits Incorporate foreground and background exit reasons into the same day performance payload.
- These metrics are suitable for storage together with version numbers, device types, and release batches to form regression trends.
diagnostics and metrics go through the same pipeline
(08:14) The new diagnostics in iOS 14 do not require rewriting the collection architecture.The subscriber continues to use the same protocol, as long as it implements another receiveMXDiagnosticPayloadmethod.
func didReceive(_ payload: [MXDiagnosticPayload]) {
    for diagnosticPayload in payload {
        // Consume diagnosticPayload.
    }
}
Key points:
- Method signature and reception
MXMetricPayloadThe versions are almost identical. - The transcript clearly states that the semantics of diagnostics are basically the same as metrics.
- The system passively collects diagnostic information within a day and finally packages it into daily diagnostic payload.
- The diagnostic payload will correspond to the metric payload of the same day, which is suitable for reusing existing reporting and back-end processing pipelines.
MXDiagnosticPayloadProvides a call stack tree that can be processed offline
(09:18) The diagnostic interface consists of several types of basic objects:MXDiagnosticis the diagnostic base class,MXDiagnosticPayloadIt is the carrying object of all diagnoses within a day,MXCallStackTreeEncapsulates the backtrace when a regression occurs.Each diagnostic also contains App metadata when the problem occurred, such as the specific build version.
(10:08)MXCallStackTreeThe backtrace in is unsymbolized data, and the design goal is offline processing.transcript description JSON contains information required for ATOS symbolization, including binary UUID, offset, name and frame address.This structure would also appear in other performance tools released by Apple that same year.
Key points:
MXDiagnosticPayloadLet the app get specific diagnoses, not just aggregated values.MXCallStackTreePreserve the call stack tree when regression occurs.- The call stack is not symbolized by default and needs to be processed outside the device in conjunction with the symbol table.
- The backend can associate the trend of metric payload with the call stack of diagnostic payload according to date, version and build.
Four types of diagnostics cover hang, CPU, disk writing and crash
(11:15) hang diagnostics records situations where the App does not respond to user input for a long time.The session clearly points to the reason that the main thread is blocked or busy, and the payload provides the duration of the main thread’s unresponsiveness, as well as the backtrace of the main thread.
(11:35) CPU exception diagnostics correspond to energy logs in Xcode Organizer.It contains the CPU time consumed during periods of high CPU usage, the total sampling time, and the thread backtrace that consumed the CPU time.It is suitable for handling CPU regressions that are difficult to reproduce locally.
(11:59) disk write exception diagnostics are very similar to CPU exception diagnostics.It records the total number of writes that triggered the exception, as well as the thread backtrace that caused the excessive writes.The trigger condition given by Apple is that the app exceeds the disk write threshold of 1 GB per day.
(12:19) Crash diagnostics are represented by MXCrashDiagnostic. Every time the app crashes, MetricKit provides exception information, termination reason, virtual memory region information under bad access crashes, and the backtrace.
Key points:
- The hang diagnosis points to the main thread being unresponsive for a long time.
- CPU exception diagnostics point to thread call stacks during periods of high CPU usage.
- The disk write exception diagnostic points to the source of a write that exceeded the daily write threshold.
- Crash diagnosis includes exception information, termination reason, partial memory area information and call stack.
Core Takeaways
-
What to do: Make a MetricKit reporting layer for the App. Why it’s worth doing: Both metrics and diagnostics passed
MXMetricManagerSubscriberFor distribution, there are few access points on the App side. How to start: Create a subscriber in the startup phase and implement it separatelydidReceive(_ payload: [MXMetricPayload])anddidReceive(_ payload: [MXDiagnosticPayload]), convert the payload into JSON that can be stored by the backend. -
What to do: Create a post-release performance regression dashboard. Why it’s worth doing: CPU instructions, scroll hits, and application exits are all online indicators aggregated on a daily basis, suitable for observing changes in new versions relative to old versions. How to start: Store the metric payload according to the build version, and first draw three groups of trends: CPU instructions, scroll hitch ratio, and foreground/background exit reasons.
-
What to do: Turn diagnostics into triage queue. Why it’s worth doing: Hang, CPU exception, disk write exception and crash all have backtrace that can be processed offline, which is closer to the root cause than simple percentage indicators. How to start: The backend is grouped by build version and diagnostic type, the call stack tree is symbolized and aggregated, and stacks with high occurrences or affecting new versions are prioritized.
-
What to do: Connect online scroll hitch indicators to XCTest performance testing. Why it’s worth doing: MetricKit provides hitch ratios during real user scrolling, and XCTest can measure animation regressions in advance in CI. How to start: Use the MetricKit data provided by this site to monitor online trends, and then refer to 10077 as the core
UIScrollViewScenarios complement performance tests that can be run repeatedly.
Related Sessions
- Diagnose performance issues with the Xcode Organizer — View aggregated performance data, version regressions, disk write diagnostics, and scrolling stutter metrics from the Xcode Organizer.
- Eliminate animation hits with XCTest — Use XCTest to measure scrolling and animation hitches to catch performance regressions before they reach online user devices.
- Identify trends with the Power and Performance API — Integrate power, performance, and diagnostic trends into the team’s own dashboard and workflow through the App Store Connect API.
Comments
GitHub Issues · utterances