
Highlight
Apple in Xcode 12 lets
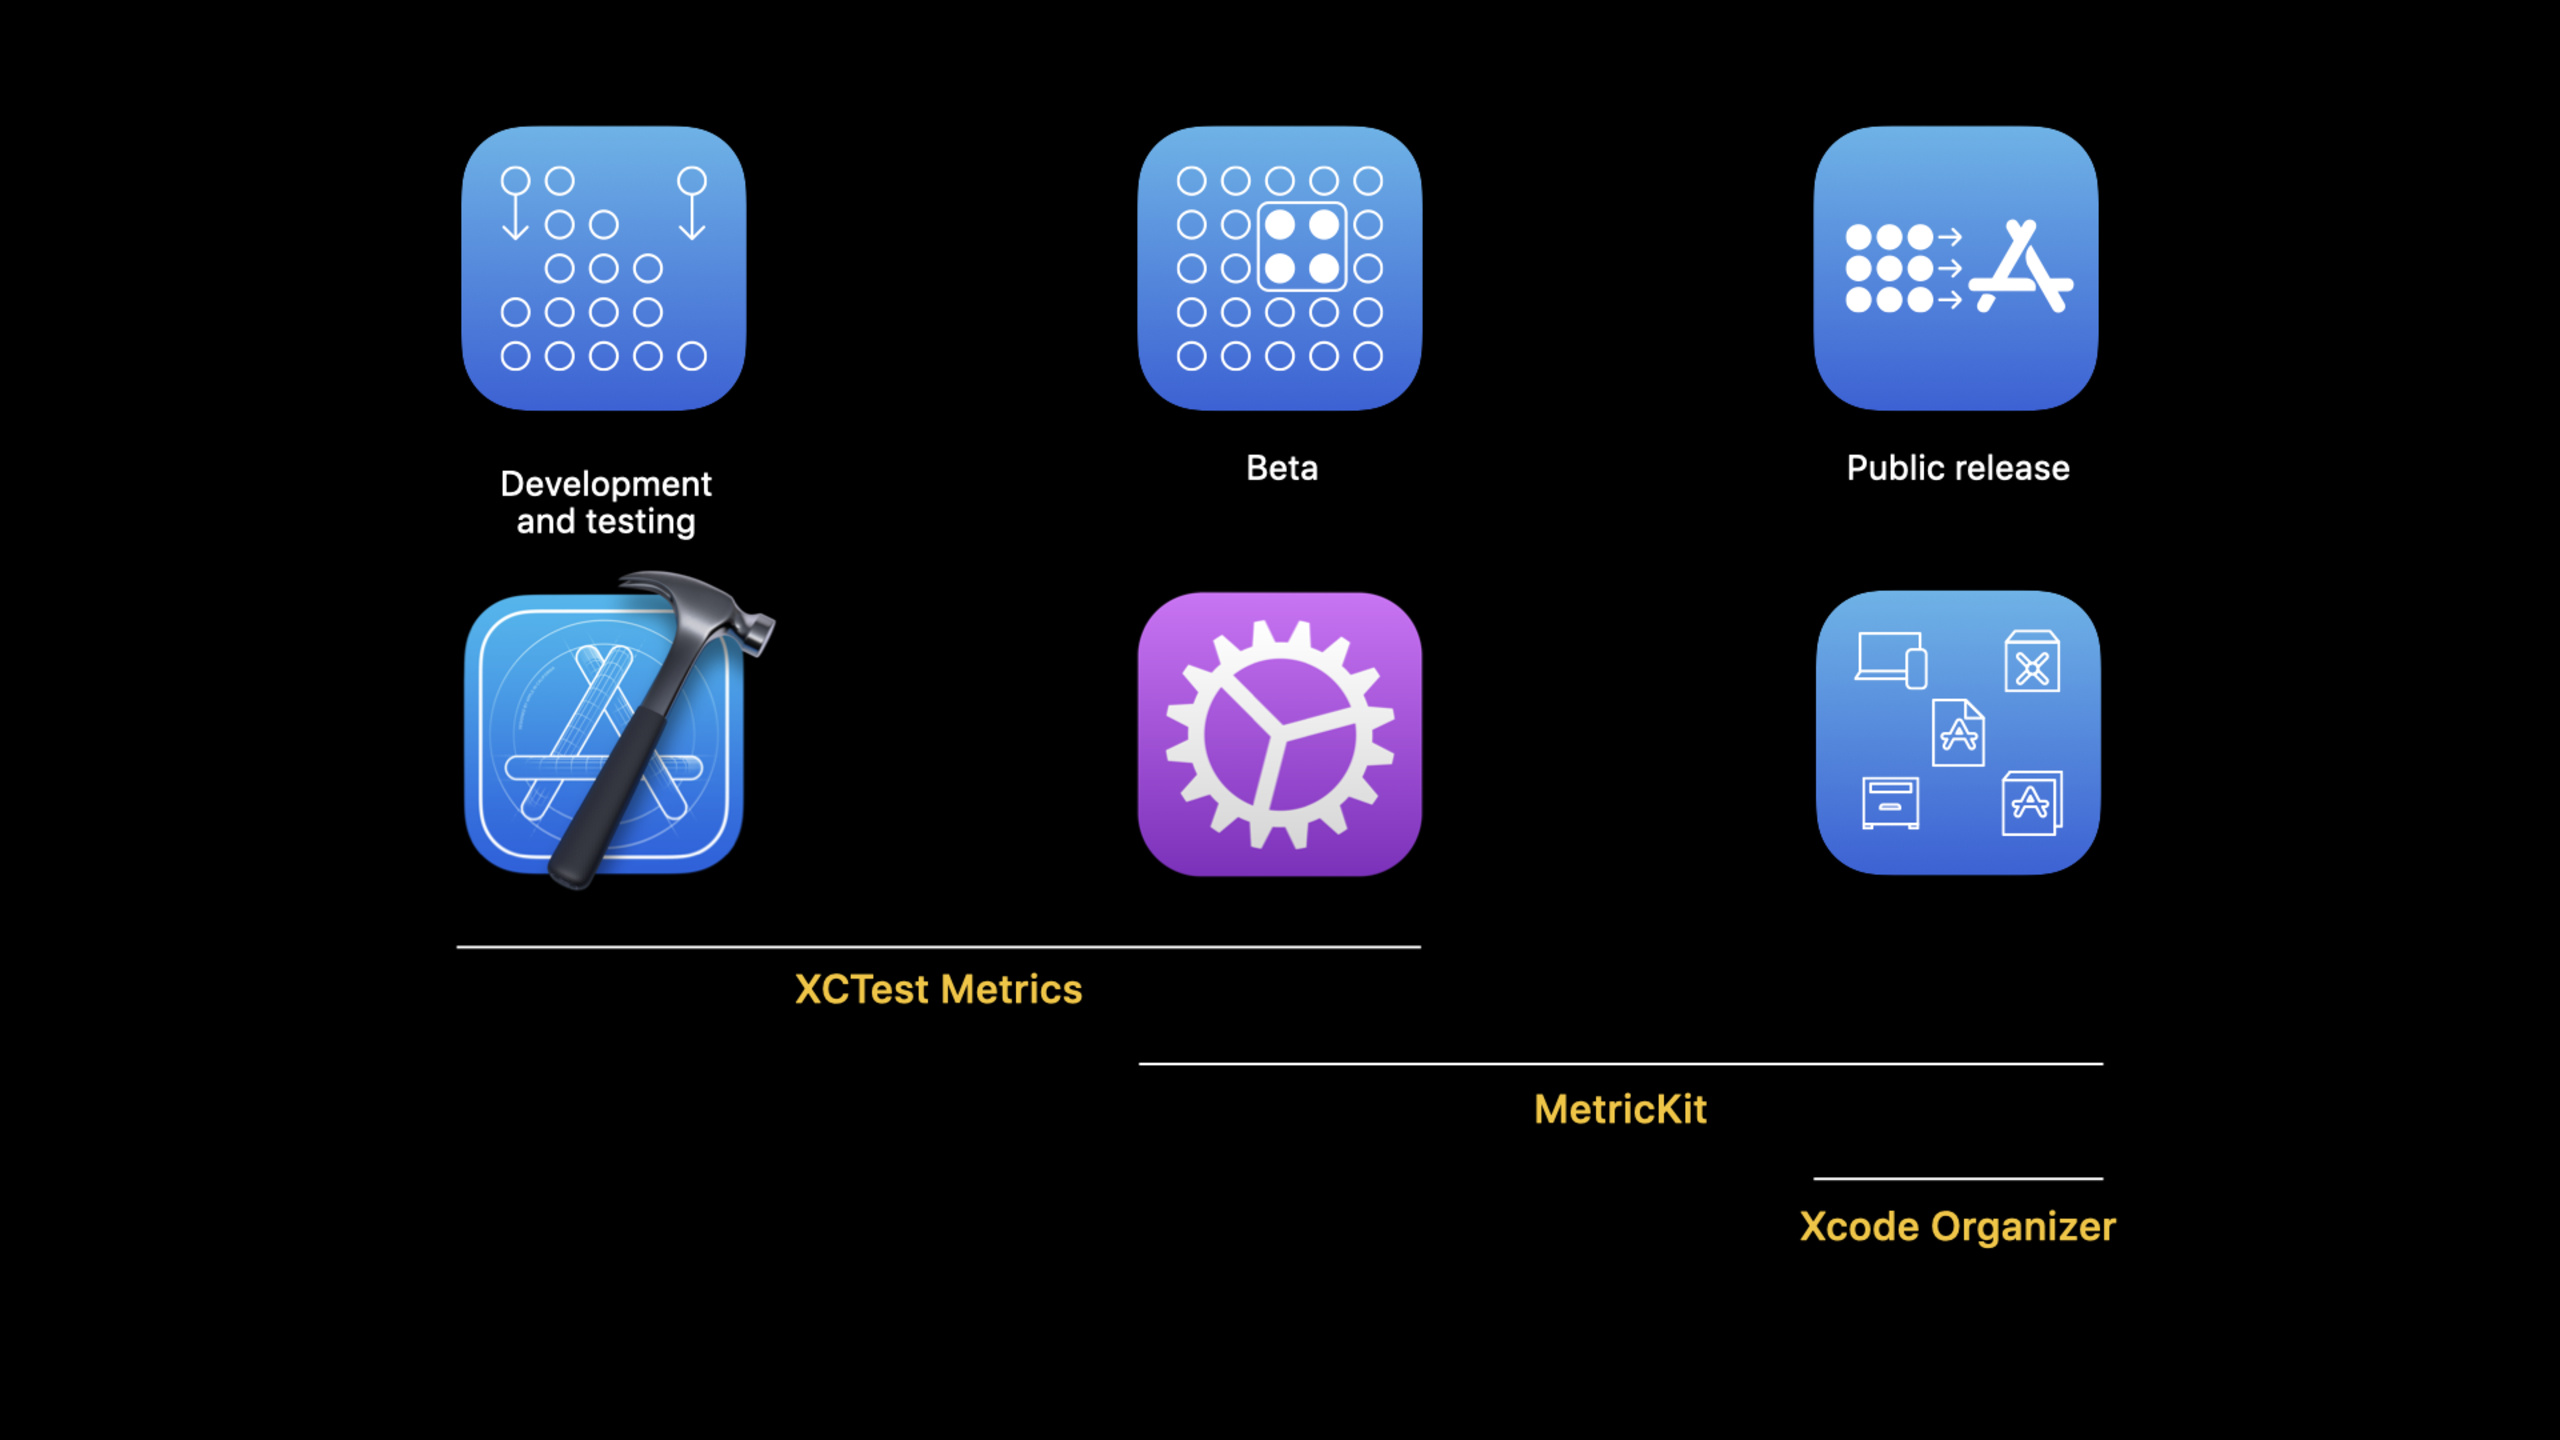
XCTOSSignpostMetricRecognize animationos_signpostInterval and UIKit scrolling and navigation sub-indicators, Performance XCTest can collect hit number, total hitch time, hitch time ratio, frame rate and frame count, and use test baselines to prevent animation regression from entering the release process.
Core Content
List scrolling and page transitions are the most underestimated performance paths.The function seems to have been completed, but as soon as the user swipes, he will find that the list does not follow the finger, stays on a certain frame for too long, and suddenly jumps back to the correct position on the next frame.session calls this user-perceived jitter a hitch: a frame appearing on the screen later than expected.
It is easy to misjudge just by looking at frames per second.If there is still time in a test, the frame rate will be skewed; game, video, and clock icons may also intentionally choose to update less often than the screen refresh rate.Apple therefore recommends using hitch time and hitch ratio to measure animation problems.The target of hitch time is always 0, and hitch ratio normalizes the total hitch time into milliseconds per second to facilitate comparison of tests of different lengths.
The change in Xcode 12 is to bring this set of indicators into XCTest.Developers can use custom animationsos_signpostFor interval marking animation, you can also directly use the scrolling and navigation intervals already marked by UIKit.After the test is run, the reporting UI will display the new animated metrics and allow the current average to be set to baseline.If the next change makes scrolling slower, Performance XCTest will be exposed first in the development process.
The demonstration of session is very specific.The Meal Planner app uses scrolling performance testing to establish a baseline before adding images to list items.After re-running the test, the number of hits increased, and the problem was located on the main thread.scaleAspectFitcall.The fix is to use Core Animation insteadsetContentMode, hand over image redrawing to the GPU, reducing the workload of the main thread.After running the test again, the animation metrics returned to zero hitch.
Detailed Content
1. First define hitch as a comparable indicator
(00:38) A hitch is a frame being displayed later than expected.The iPhone and iPad typically update their screens at 60Hz, about 16.67ms per frame; the iPad Pro can go to 120Hz, about 8.33ms per frame.Whenever a frame misses the expected VSYNC, a hitch occurs.
(02:10) Apple provides two quantification methods.The hitch time is the number of milliseconds until a frame arrives on the screen; the hitch ratio is the total hitch time during the test divided by the test duration, in milliseconds per second.The experience line given in the session is: less than 5ms/s is a good experience, 5 to 10ms/s needs to be investigated, and 10ms/s or higher should be dealt with immediately.
2. Use animation signpost to mark the custom animation interval
(06:35)XCTOSSignpostMetricMeasurement is already possible in Xcode 11os_signpostThe duration of interval.After adding animation interval in Xcode 12, change the start event from ordinary begin toanimationBegin, the same tag can return animation-related indicators.
os_signpost(.animationBegin, log: logHandle, name: "performAnimationInterval")
os_signpost(.end, log: logHandle, name: "performAnimationInterval")
Key points:
animationBeginDeclare that this interval corresponds to screen animation.endEnd the interval with the same name, and the test will only count the animation performance that occurred within this interval.- Xcode 12 returns hit number, total hitch time, hitch time ratio, frame rate and frame count in addition to duration.
3. Directly use UIKit marked scrolling and navigation intervals
(06:55) There are many UIKit scenes that you don’t need to cover yourself.XCTOSSignpostMetricIt provides sub-indicators such as navigation transition, scroll deceleration, and scroll drag, which are suitable for directly covering the most common interaction paths in the app.
extension XCTOSSignpostMetric {
     open class var navigationTransitionMetric: XCTMetric { get }
     open class var customNavigationTransitionMetric: XCTMetric { get }
     open class var scrollDecelerationMetric: XCTMetric { get }
     open class var scrollDraggingMetric: XCTMetric { get }
}
Key points:
navigationTransitionMetricUsed to measure standard navigation transitions.customNavigationTransitionMetricOverride custom navigation transitions.scrollDecelerationMetricPay attention to the scrolling deceleration phase after your finger leaves.scrollDraggingMetricPay attention to the scrolling performance during user dragging.
4. Write the scrolling performance as Performance XCTest
(07:12) The sample test first starts the application, enters the Meal Planner page, and then finds the first collection view.measure(metrics:)Wrap it once and slide up quickly, XCTest will collectscrollDecelerationMetricThe corresponding animation indicator.
// Measure scrolling animation performance using a Performance XCTest
func testScrollingAnimationPerformance() throws {
    app.launch()
    app.staticTexts["Meal Planner"].tap()
    let foodCollection = app.collectionViews.firstMatch

    measure(metrics: [XCTOSSignpostMetric.scrollDecelerationMetric]) {
        foodCollection.swipeUp(velocity: .fast)
    }
}
Key points:
app.launch()Ensure that each test starts when the application is launched.app.staticTexts["Meal Planner"].tap()Enter the page to be measured.app.collectionViews.firstMatchFind the list container.measure(metrics:)Specify that this performance test collects scrolling deceleration indicators.swipeUp(velocity: .fast)Reduce the randomness of gesture input using the scroll speed parameter supported in Xcode 12.
5. Reset application status after each round of measurement
(08:02)measureBy default it will run five times.Just swipe up five times in a row. Different content may be measured in the subsequent rounds.For exampleXCTMeasureOptionsEnable manual stop and slide the list back after stopping the measurement.
func testScrollingAnimationPerformance() throws {
    app.launch()
    app.staticTexts["Meal Planner"].tap()
    let foodCollection = app.collectionViews.firstMatch

    let measureOptions = XCTMeasureOptions()
    measureOptions.invocationOptions = [.manuallyStop]

    measure(metrics: [XCTOSSignpostMetric.scrollDecelerationMetric],
            options: measureOptions) {
        foodCollection.swipeUp(velocity: .fast)
        stopMeasuring()
        foodCollection.swipeDown(velocity: .fast)
    }
}
Key points:
XCTMeasureOptions()Create run options for this measurement..manuallyStopAllow the test code to actively end indicator collection.stopMeasuring()Subsequent operations no longer enter the performance sample.swipeDown(velocity: .fast)Restore the list to a comparable state for the next round.
(08:18) The test scheme will also affect the results.session It is recommended to establish a separate scheme for Performance XCTest, use Release build configuration, turn off debugger, automatic screenshots, code coverage, and diagnostic options in Runtime Sanitization, Runtime API Checking, and Memory Management.
(09:01) The reporting UI displays new animated metrics.Example After selecting Hitch Time Ratio, the five-round average is 1.2ms/s.Developers can set this average as a baseline and let future tests compare against it.
(11:12)XCTOSSignpostMetricOnly count the target signpost interval emitted in the measure block.A measure block can also monitor multiple different intervals, such as monitoring at the same time on the same slide.scrollDecelerationMetricandscrollDraggingMetric。
Core Takeaways
-
Add a scrolling baseline to your core list: What to do: Write one for your homepage feed, product list, or gallery
scrollDecelerationMetrictest.Why it’s worth doing: Performance degradation on such pages usually comes from images, shadows, layout calculations, or data binding, and the first thing users perceive is the scroll hitch.How to start: Choose a fixed entrance and execute it after entering the pageswipeUp(velocity: .fast), set the current stable result to baseline. -
Incorporate transition animation into UI testing: What to do: Add jumps to key pages
navigationTransitionMetricorcustomNavigationTransitionMetric.Why it’s worth doing: Navigation transitions are often sandwiched between data preparation and view construction, and the pressure on the main thread will directly turn into visible lag.How to start: Use UI test to trigger tap once, and then letmeasure(metrics:)Wrap transition actions. -
Add signpost to custom animation: What to do: Add animation around self-developed animation, complex gestures or canvas update code
os_signpost.Why it’s worth doing: UIKit already covers common scrolling and navigation, but business custom animations require defining measurement boundaries yourself.How to start: Useos_signpost(.animationBegin, ...)Japanese same name.endWrap the animation interval and use it in the testXCTOSSignpostMetricCollection results. -
Separately fix the performance test environment: What to do: Establish an independent scheme for Performance XCTest.Why it’s worth doing: Debuggers, screenshots, coverage, and runtime diagnostics will all interfere with measurement results, and the baseline will become unstable.How to start: Copy the existing test scheme, change it to Release, and turn off the debugging and diagnostic options listed in the session.
-
Protect new images with tests now available: What to do: Run the same scrolling performance test before and after adding images, thumbnails, or dynamic content to list items.Why it’s worth doing: The session demonstration shows that main thread image scaling will directly increase hitch.How to start: First record zero hitch or low hitch baseline, combine the image function and compare the indicators. When a regression is found, check the decoding, scaling and drawing work on the main thread first.
Related Sessions
- Diagnose performance issues with the Xcode Organizer — View power and performance indicators from real user aggregate data, and complete post-release scroll hitch monitoring.
- What’s new in MetricKit — Introducing MetricKit’s new animation hitch, diagnostic payload and performance regression troubleshooting capabilities in iOS 14.
- Identify trends with the Power and Performance API — Connect the metrics behind Xcode performance tools to your team dashboard for long-term trend and regression tracking.
- Get your test results faster — Talks about test planning, timeout and parallel execution, suitable for optimizing feedback speed together with Performance XCTest.
- Write tests to fail — Talk about how to design XCTest to make it easier to locate problems, to enhance the diagnostic process after performance test failure.
Comments
GitHub Issues · utterances