
Highlight
The Organizer of Xcode 12 can generate version comparison, scroll hitch indicators and disk write diagnostic reports from aggregate power, performance and I/O data on agreed-to-share devices without changing the app.
Core Content
When optimizing app performance, developers often encounter an embarrassing problem: the devices and test scripts in hand can only cover a small number of scenarios, and the real user devices, system versions, and usage methods are much more complicated.You know you need to improve battery life and smoothness, but it’s hard to tell where to fix first in the next version.(00:30)
The entrance provided by Xcode Organizer is very straightforward: open Xcode and select Window > Organizer.No changes are required to the app.Once the user agrees to share, Apple collects power, performance and I/O data, aggregates it on the server side, and returns it to the development team through Organizer.(01:43)
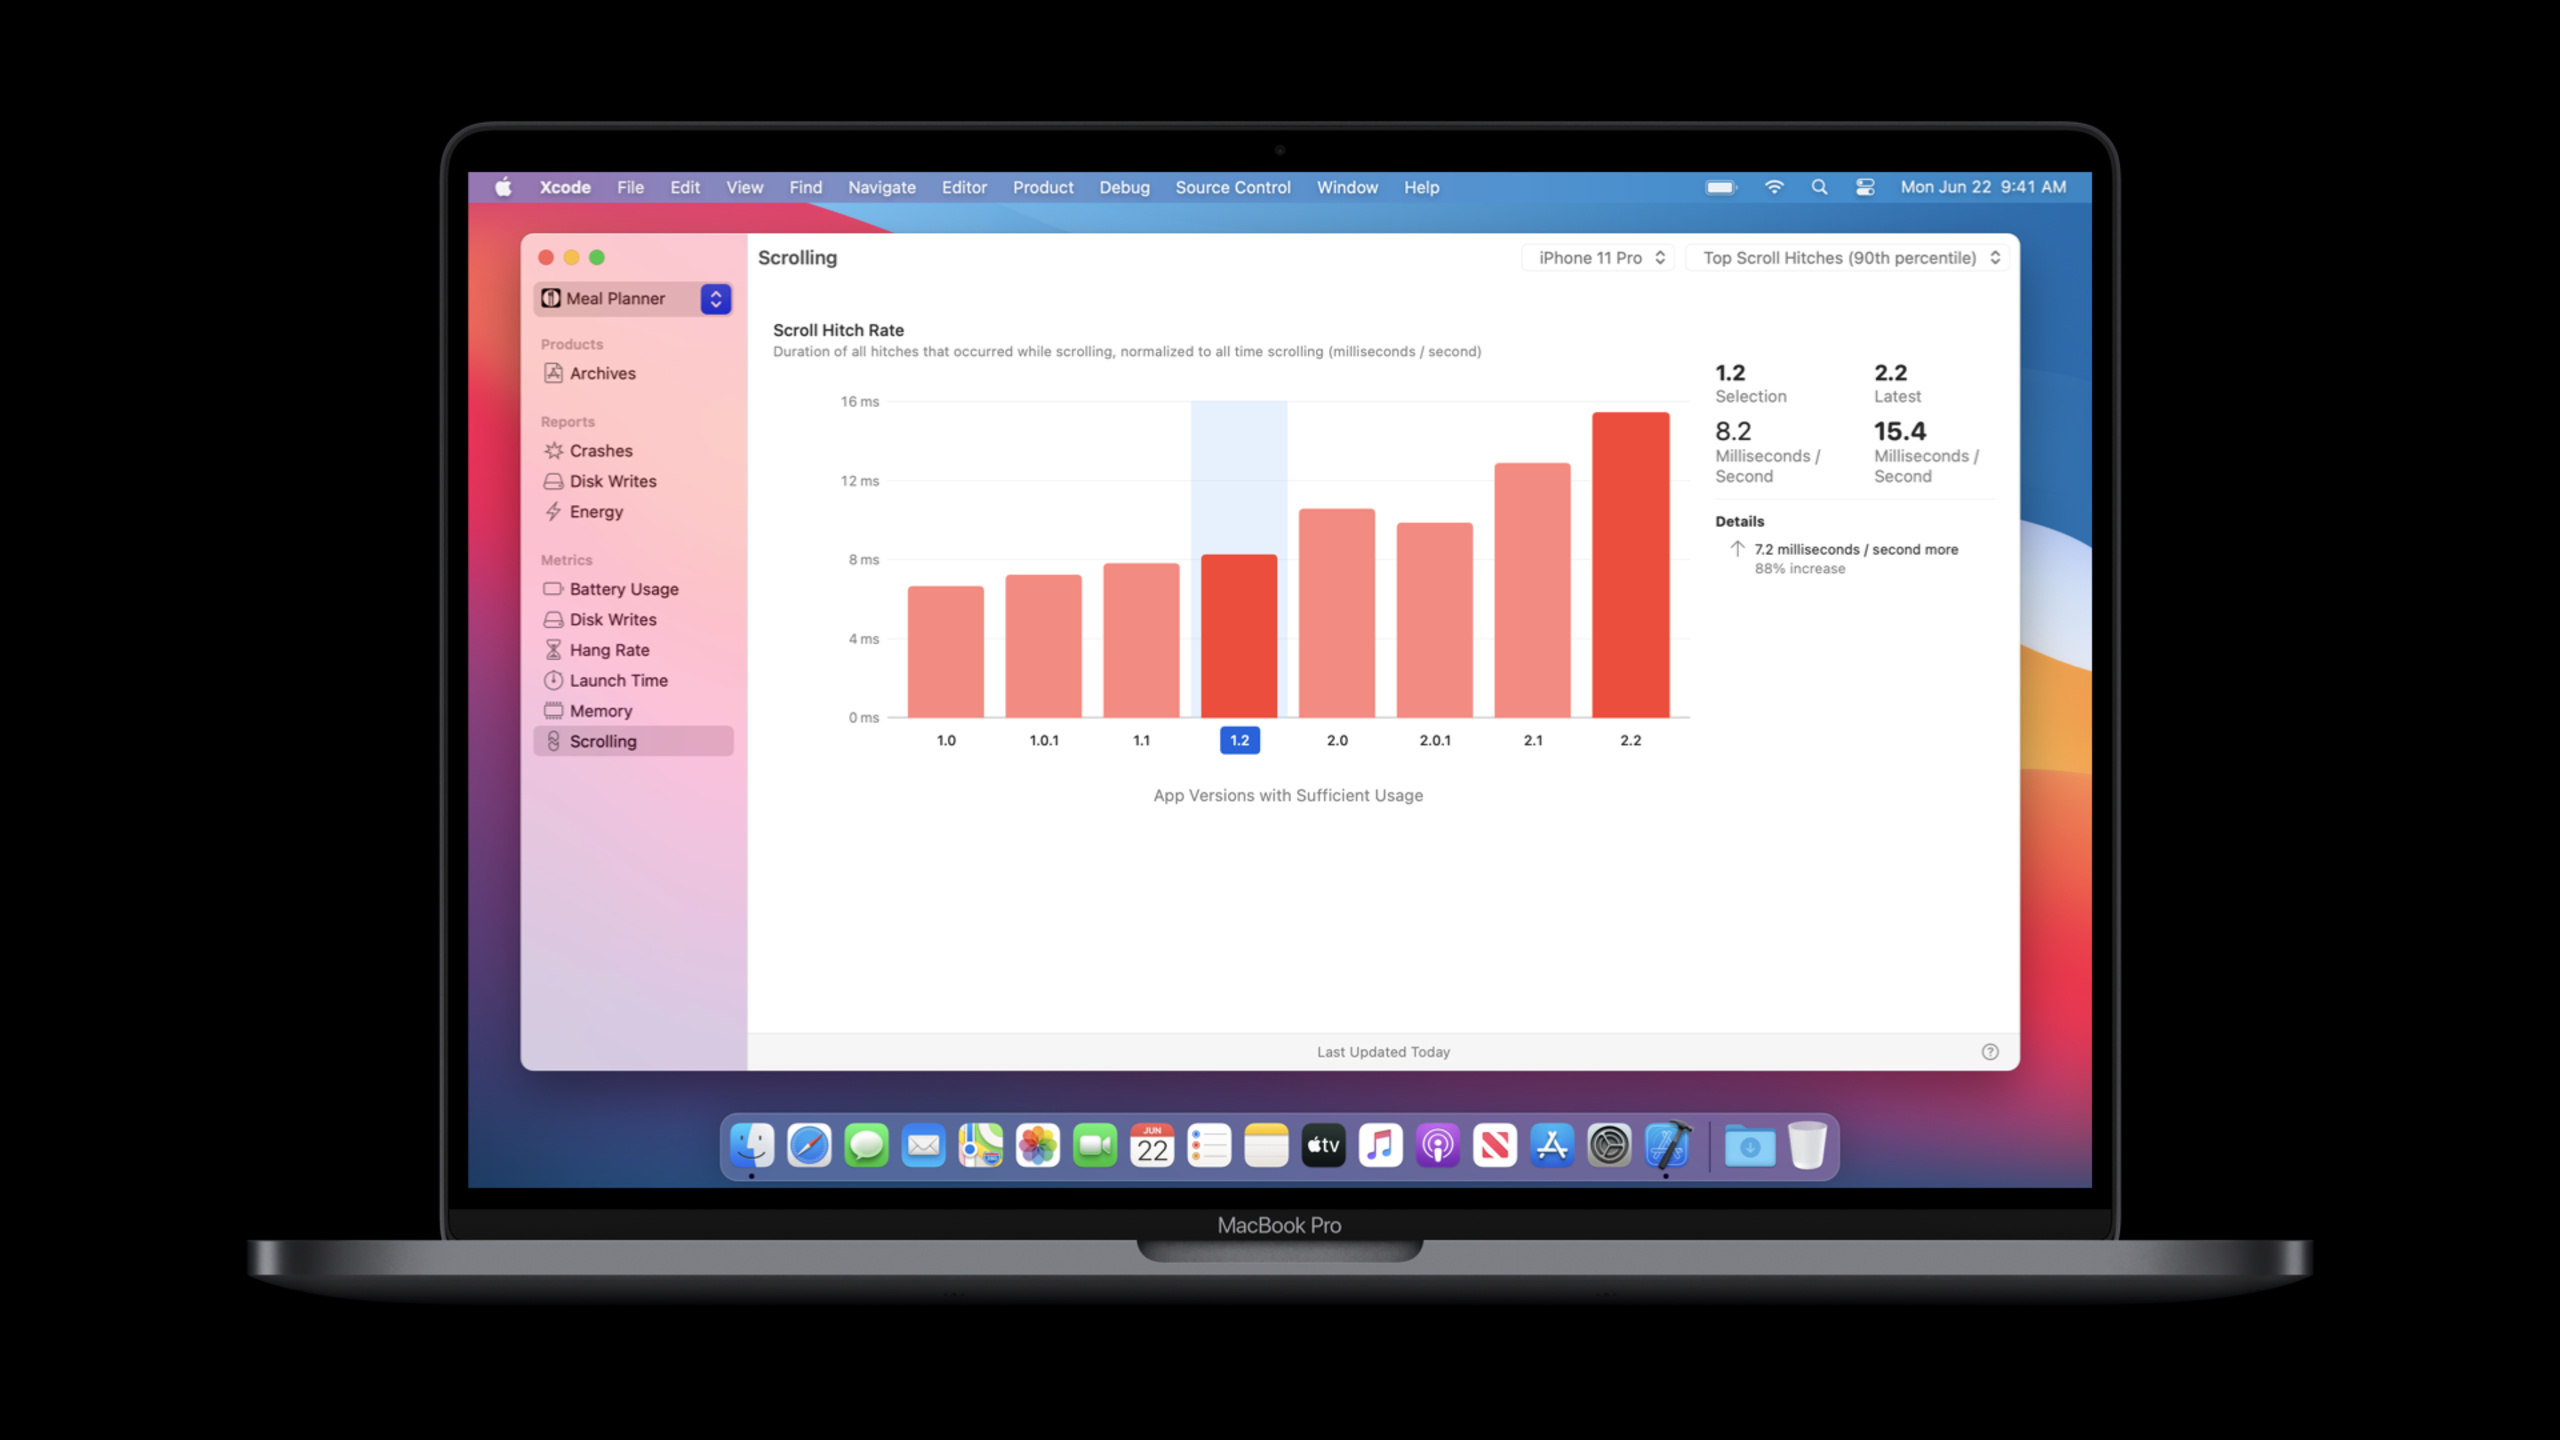
There are three changes in 2020.Organizer has added a scroll hitch indicator to measure whether scrolling frames appear on the screen as expected; added disk write diagnostics reports to use the call stack to help you locate excessive disk writes; and redesigned the interactive interface to make comparison of indicators between two App versions a one-click operation.(02:41)
The Meal Planner in the demo looks a lot like the real thing.After adding custom photos and recipes to the new version, Organizer first showed that disk writes suddenly increased in version 2.2, and then used Reports > Disk Writes to split the problem into different signatures.The developer jumps back to the corresponding code from the stack trace, and after repair, returns to metrics to confirm data recovery.(08:31)
Detailed Content
Open Organizer to see online aggregated indicators
(00:51) Organizer is provided with Xcode and does not require the App to integrate additional code.It displays aggregated battery, performance, and I/O metrics on agreed-to-share devices, and is suitable for answering “what problems have real users encountered?”
Xcode > Window > Organizer
source = consented user devices
aggregation = Apple servers
metrics = battery, performance, IO
app changes required = none
Key points:
Window > OrganizerIt is the entrance clearly given by this session.- Data comes from devices that agree to be shared and is aggregated by Apple before being returned.
- This type of data is suitable for post-release observation and does not replace local Instruments or XCTest performance testing.
- The article does not write these data as real-time logs, because the transcript only states that they will be aggregated and displayed in the Organizer.
scroll hitch rate turns scroll hitch into a comparable indicator
(03:19) Scroll hitch means that during scrolling, a certain rendered frame does not appear on the screen at the expected time.The results users see are jitters, lags, or dropped frames.
hitch rate = hitch time / scroll duration
smooth range = less than 5 ms/s
warning range = 5 to 10 ms/s
poor range = greater than 10 ms/s
Key points:
hitch timeis the total additional time spent on the frame.scroll durationis the total time the user spent scrolling within the app.- At less than 5 ms/s, users will mostly experience smooth scrolling.
- 5 to 10 ms/s means dropping frames every few seconds.
- Greater than 10 ms/s means that frame drops will occur frequently and the scrolling experience will become worse.
New UI uses version comparison to position and release regression
(05:45) The new Organizer interface of Xcode 12 supports clicking on the old version to compare side by side with the latest version.In the demo, the latest version of Meal Planner showed up in the battery usage subcategories of Camera and Bluetooth, so developers immediately knew where to look next.
open Organizer
select an older app version
compare latest version with selected version
inspect metric subcategories
check limited-usage icon and margin of error
Key points:
- Version comparison is an interaction triggered after clicking on the old version, and does not require manual export of the table.
- battery usage continues to be split into subcategories, with Camera and Bluetooth appearing in the demo.
- Xcode 12 lowers the usage threshold required to display data to one-fifth of the original amount.
- Limited usage versions will show an icon and error range; as more users upgrade, the error range will decrease.
disk write diagnostics From the indicator peak to the call stack
(05:00) Disk write diagnostics logs are aggregated when more than 1GB is written to the disk within 24 hours.It fills in the missing context from the previous year when only disk write metrics were available.
Disk Writes metric spike
-> Reports > Disk Writes
-> inspect signatures
-> review device and OS breakdown
-> inspect 14-day report trend
-> read sample stack traces
-> mark signature as resolved
-> confirm metrics return after users adopt the fix
Key points:
- Disk Writes reports aggregating issues by signature, and the proportion of disk writes it accounts for is displayed below signature.
- The report on the right is split by device type and system version, and shows the trend of reports received in the last 14 days.
- Organizer provides sample stack traces and Details areas to help developers return to the code path that caused the disk write.
- After the demonstration is repaired, the signature will be marked as resolved, and the user will return to metrics verification after using the repaired version.
Core Takeaways
-
What to do: Add Organizer version comparison to the checklist after each release.Why it’s worth it: Xcode 12 lets you directly compare battery, performance, and I/O metrics between two versions.How to start: After the new version is online, open Window > Organizer, select the previous version, and record the suddenly increased indicators and subcategories.
-
What to do: Establish a scrolling experience acceptance line for the core list page.Why it’s worth doing: The scroll hitch rate divides the bounce felt by the user into three ranges: less than 5, 5 to 10, and greater than 10 ms/s.How to start: First use Organizer to find pages with higher online hitch, and then use XCTest of Session 10077 to cover the same scroll path before publishing.
-
What to do: Track excessive disk writes separately as a release regression.Why it’s worth doing: Organizer will aggregate disk write diagnostics when the disk write exceeds 1GB in 24 hours, and display the signature, ratio, device and system distribution.How to start: After seeing the Disk Writes indicator peak, go to Reports > Disk Writes, assign the repair person according to signature, and mark resolved after the repair.
-
What: Separately mark data credibility for low-usage versions.Why it’s worth it: Xcode 12 displays data earlier, but the limited-usage version will have a margin of error.How to start: Record Organizer’s limited-usage icon and margin of error in the release board, and then review the same indicator after more users upgrade.
Related Sessions
- Identify trends with the Power and Performance API — Integrate power, performance, and diagnostic data behind Xcode Organizer into team dashboards, alerts, and bug systems.
- Eliminate animation hits with XCTest — Use XCTest to measure scrolling and animation hits before release, and supplement local regression checks before Organizer online indicators.
- What’s new in MetricKit — Learn about MetricKit’s new performance metrics and diagnostic payloads in iOS 14, including animation hits and disk writes.
Comments
GitHub Issues · utterances