
Highlight
App Store Connect will open Xcode Organizer’s aggregate power, performance, I/O metrics and diagnostic data as Power and Performance API in 2020. Teams can connect trends, regressions and call stacks to custom dashboards and alert processes.
Core Content
Xcode 11’s Organizer can already display the aggregate power, performance, and I/O metrics of online apps. The problem is that this data used to mostly stay in Xcode. When the team wants to put the same batch of data into its own monitoring pipeline, dashboard or bug system, it can only rely on manual review and then move the conclusions elsewhere. (00:48)
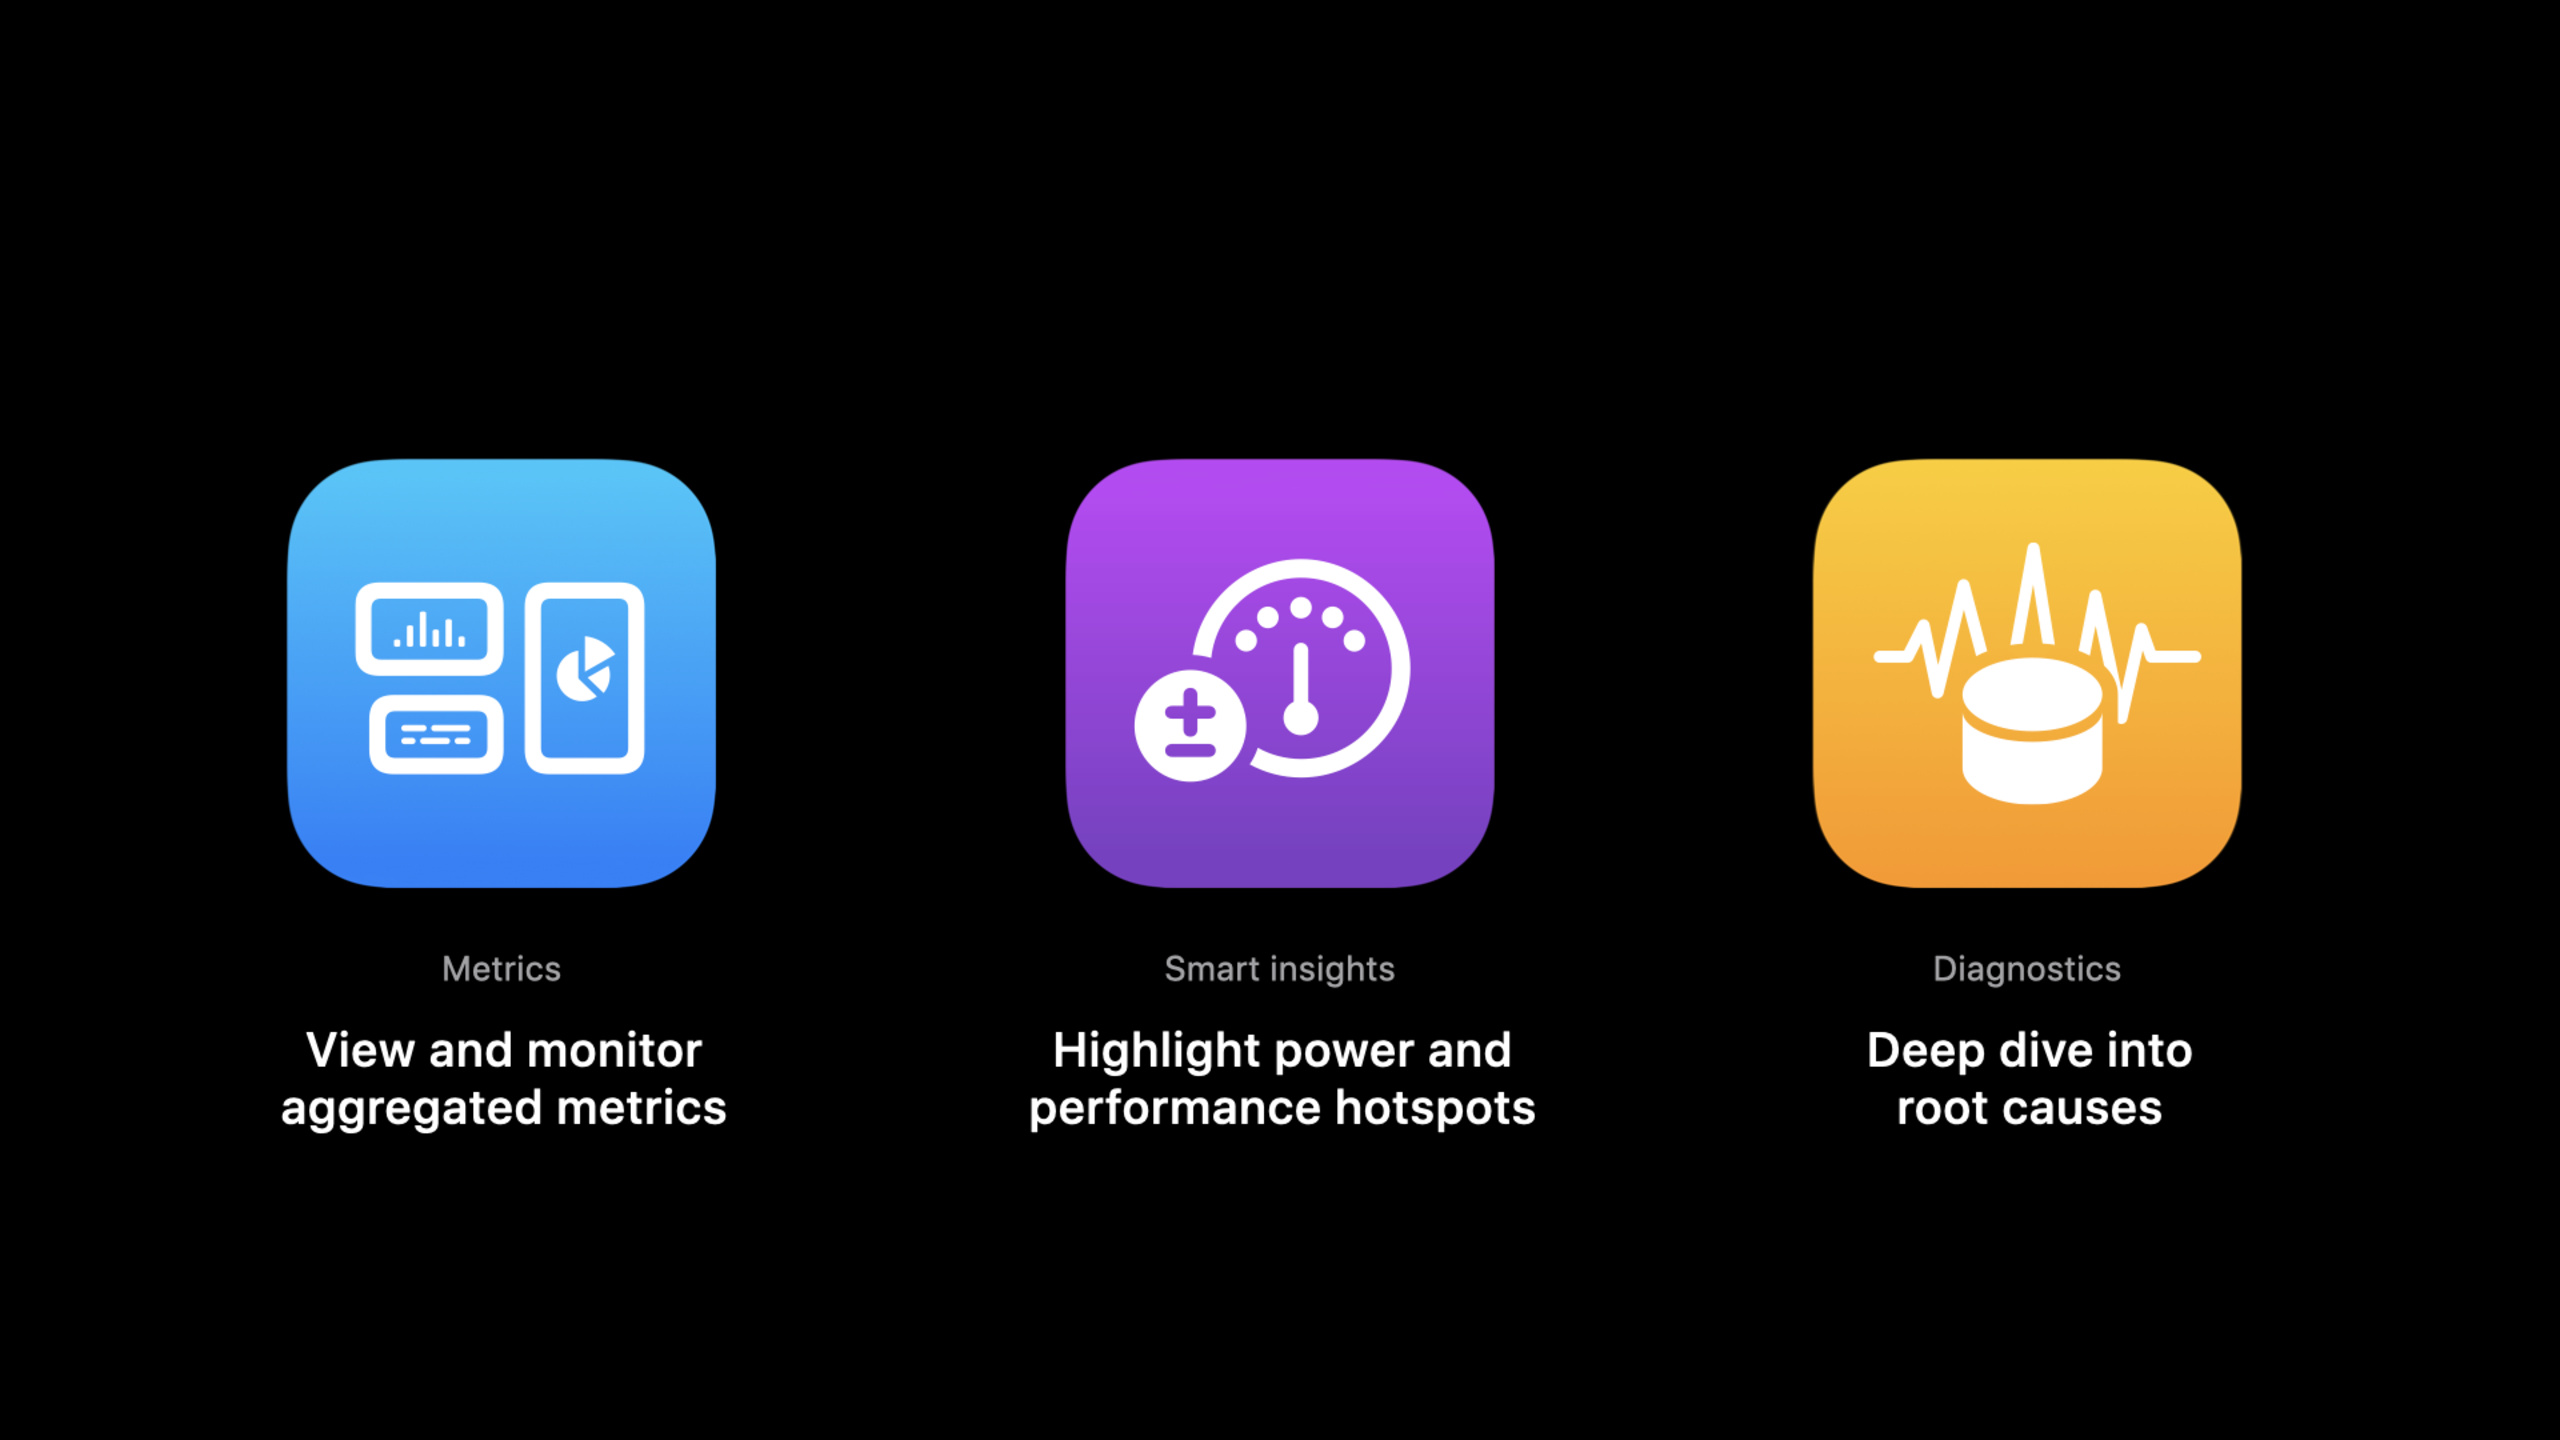
The answer given in this session is the Power and Performance API in the App Store Connect API. It turns the metrics, diagnostics, and new smart insights behind Xcode Organizer into programmatically accessible data. The data comes from devices that users have agreed to share, and Apple aggregates it on the server side and makes it available to development teams through APIs. (01:21)
The value of an API is most evident after release. After the new version goes online, the team can automatically pull the latest version of productData and insights, and observe the changes in battery drain, launch, disk writes, hang rate and other indicators on different devices and percentiles. When a regression occurs, use diagnostic signatures to find the main problem group, and pull diagnostic logs to see the call stack. (04:26)
The MealPlanner in the demo has this process. It added the ability to save photos, and the team discovered through the API that the latest version had disk writes regression on the 50th percentile of all iPhone users. Then request top diagnostic signatures, then download the corresponding logs, and finally trace the disk writes caused by the new photo function from the call stack. (10:24)
Detailed Content
One API link covering trends, regressions and root causes
(02:55) Apple introduced four types of REST API resources in this session: use App ID to obtain aggregated indicators and insights of the latest version; use build ID to download indicators of a specific version; use build ID to obtain top diagnostic signatures; use signature ID to download diagnostic logs. The official Code tab shows three of the core requests.
GET /v1/apps/{id}/perfPowerMetrics
GET /v1/builds/{id}/diagnosticSignatures
GET /v1/diagnosticSignatures/{id}/logs
Key points:
perfPowerMetricsis for App resources and is used to get the latest version of aggregated metrics and smart insights.diagnosticSignaturesis for build resources and is used to aggregate similar questions into sortable question groups.diagnosticSignatures/{id}/logstargets specific signatures and is used to download anonymous diagnostic logs that can be used for root cause analysis.- The transcript also mentions a resource for downloading metrics of a specific version by build ID, but the Code tab does not give a specific URL, and the article does not add the endpoint that is not shown.
perfPowerMetrics returns productData and insights
(04:48) Application-level metrics are requested using the App ID. The return value is structured JSON, which is mainly divided into two parts: productData and insights.
GET /v1/apps/{id}/perfPowerMetricsKey points:
{id}is the application ID in the App Store Connect API.productDatasaves aggregated metrics. Each metric has its own metadata, such as unit.- Each combination of metric and device gives a 50th percentile and a 90th percentile.
- metrics summary covers up to 8 recent app versions.
insightsautomatically marks hot spots using the previous metrics. The example given in the session is that launch time only returns on the 90th percentile iPhone users.
This step is suitable for trend dashboard. The background task requests perfPowerMetrics at a fixed period, and the storage is separated by metric, device, percentile and version, so that the trends seen in the Xcode Organizer can be integrated into the team’s own tools.
Accessing the API requires App Store Connect token and metrics Accept header
(11:19) The demonstration first uses the App Store Connect API key to generate an access token, and then uses the token to request perfPowerMetrics. The official code snippet shows two key headers using curl.
curl -X GET -H "Authorization: Bearer ${JWT}" -H "Accept: application/vnd.apple.xcode-metrics+json,application/json" https://api.appstoreconnect.apple.com/v1/apps/${id}/perfPowerMetricsKey points:
Authorization: Bearer ${JWT}uses the token generated by the App Store Connect API key.Acceptdeclares bothapplication/vnd.apple.xcode-metrics+jsonand plain JSON.${id}is the App ID of the target App such as MealPlanner.- The response will return both
productDataandinsights, and the demonstration then directly checks the regression summary ininsights.
diagnostic signatures Group similar problems together
(08:19) After discovering the regression, the next step is to get diagnostic signatures from the build dimension. session explicitly states that disk writes diagnostic signatures can be accessed through Xcode and API in 2020.
GET /v1/builds/{id}/diagnosticSignaturesKey points:
{id}is the build ID provided by the App Store Connect API.- The returned
datalist contains multiple signatures, each signature has a unique ID and attributes. - The signature string corresponds to the call frame in the Xcode UI and is used to represent this set of call stacks.
weightis the normalized signature weight, indicating the relative importance of the signature.- The response will also contain a related URL, which already contains the signature ID, and you can continue to request logs.
In the demonstration, MealPlanner first uses the build ID of the latest App version to request the top signatures, and then takes the top-ranked disk writes signature for further analysis.
diagnostic logs provide device metadata and call stack tree
(09:42) After getting the signature ID, you can request the corresponding diagnostic logs. It contains anonymous diagnostic details from a single device.
GET /v1/diagnosticSignatures/{id}/logsKey points:
{id}is the signature ID in the previousdiagnosticSignaturesresponse.diagnosticMetadatacontainsdeviceType,osVersion,buildVersionand other information.- Disk writes events like this will bring
callStacks. - Each call stack frame contains
rawFrame, parsed frame information andsubFrames. - By traversing
subFramesdownward from the root frame, the complete call stack tree can be restored. - Transcript clearly mentioned that this call stack JSON structure is shared with MetricKit and is suitable for reusing parsing logic.
The final step in the demo is to pretty-print the call stack. Yeounoh looks up from the bottom frame, locates the new photo saving function that causes heavy disk writes I/O, and then returns to the source code location for optimization. (13:22)
Core Takeaways
-
What to do: Make a post-release performance trend dashboard. Why it’s worth doing:
perfPowerMetricsgives the latest version of aggregated metrics, and the data granularity includes metric, device, 50th percentile and 90th percentile. How to start: Use App ID to requestGET /v1/apps/{id}/perfPowerMetricsregularly, writeproductDatainto the timing library by version, and first draw four trends: launch, battery drain, disk writes and hang rate. -
What to do: Connect smart insights to regression alerts. Why it’s worth doing: Insights JSON directly contains analyzed versions, regression summary, impacted devices and percentiles, which is suitable for turning into readable alerts. How to start: Read
insightsafter each new version has enough online data, and write the summary string, affected devices and percentile into Slack or issue tracker. -
What: Automatically generate diagnostic triage work orders. Why it’s worth doing:
diagnosticSignatureswill aggregate similar problems and giveweight, so the team can deal with the signature with the greatest impact first. How to start: For the abnormal build requestGET /v1/builds/{id}/diagnosticSignatures, sort byweight, and attach the signature string and related logs URL to the work order. -
What: Reuse a set of call stack parsers to process API logs and MetricKit diagnostics. Why is it worth doing: The session clearly states that the call stack JSON structure of diagnostic log is shared with MetricKit. The same parser can cover server-side aggregated logs and device-side diagnosis. How to start: Starting from the
callStacksentry ofGET /v1/diagnosticSignatures/{id}/logs, recursively traversesubFramesand output a readable frame tree and device metadata.
Related Sessions
- Expanding automation with the App Store Connect API — Introduces the automation scope of the App Store Connect API, and continues with the Power and Performance Metrics and Diagnostics API at the end.
- Diagnose performance issues with the Xcode Organizer — View the same aggregated metrics, version comparisons, and disk write diagnostics from the Xcode Organizer UI perspective.
- What’s new in MetricKit — Talk about device-side MetricKit metrics and diagnostics, and supplement the call stack structure shared with this site.
- What’s new in App Store Connect — A summary of 2020 App Store Connect updates, including the App Store Connect API, subscriptions, in-app purchases, and Game Center.
Comments
GitHub Issues · utterances