
Highlight
Xcode 12 和 Instruments 把 Apple GPU 的 performance limiters、memory bandwidth、occupancy、HSR 等 counters 暴露到 encoder 和 draw call 级别,让 Metal 开发者能从最长的 pass 追到具体资源与 shader。
核心内容
一个 Metal 游戏掉帧时,开发者很容易先看到“GPU 忙”。这还不够。真正要回答的是:最长的是哪个 command encoder?它卡在 ALU、Texture Sampler、Buffer、Tile Memory,还是 Pixel Backend?如果没有 GPU counters,优化就会变成关闭特效、修改 shader、重新运行,再猜一次。
这场 session 把排查顺序讲得很清楚。先用 Instruments 的 Game Performance template 录制真实设备上的一帧,打开 Performance Limiters 和 Shader Timeline,找到耗时最长的 encoder。再把同一帧交给 Xcode Metal Debugger,在 encoder 或 draw call 粒度查看 counters,把“慢”拆成具体硬件单元。
这些数字必须放回 Apple GPU 的 TBDR(Tile Based Deferred Renderer,基于 tile 的延迟渲染)架构里读。Apple GPU 没有独立 Video Memory,CPU 和 GPU 共享 System Memory,GPU core 依赖片上的 Tile Memory、ALU、Texture Unit、Pixel Backend 和共享的 last level cache。纹理格式、storage mode、load/store action、draw order,都会影响一帧是不是有效率。
演讲的最后一个 demo 很有代表性。团队从 Xcode 的 Memory group 出发,按 Bytes Read From Main Memory 排序,切到 Per-Draw Counters mode,最终在 Bound Resources 里找到一个 shared storage 的 RGBA16 floating-point cube map。把它改成 private storage 之后,可以启用 lossless texture compression;再配合 block-compressed texture assets,游戏在 iPad Pro 上稳定跑到 120 FPS。
详细内容
先从工具链定位最长的 encoder
(04:33)Apple 给出两个入口。Metal System Trace 属于 Instruments,适合先看 CPU/GPU timeline、系统状态和帧内不同 encoder 的耗时。Metal Debugger 属于 Xcode,适合做更深的性能调查,因为它能在 encoder 粒度列出所有 GPU counters,也能在 draw call 粒度展示一大部分 counters。
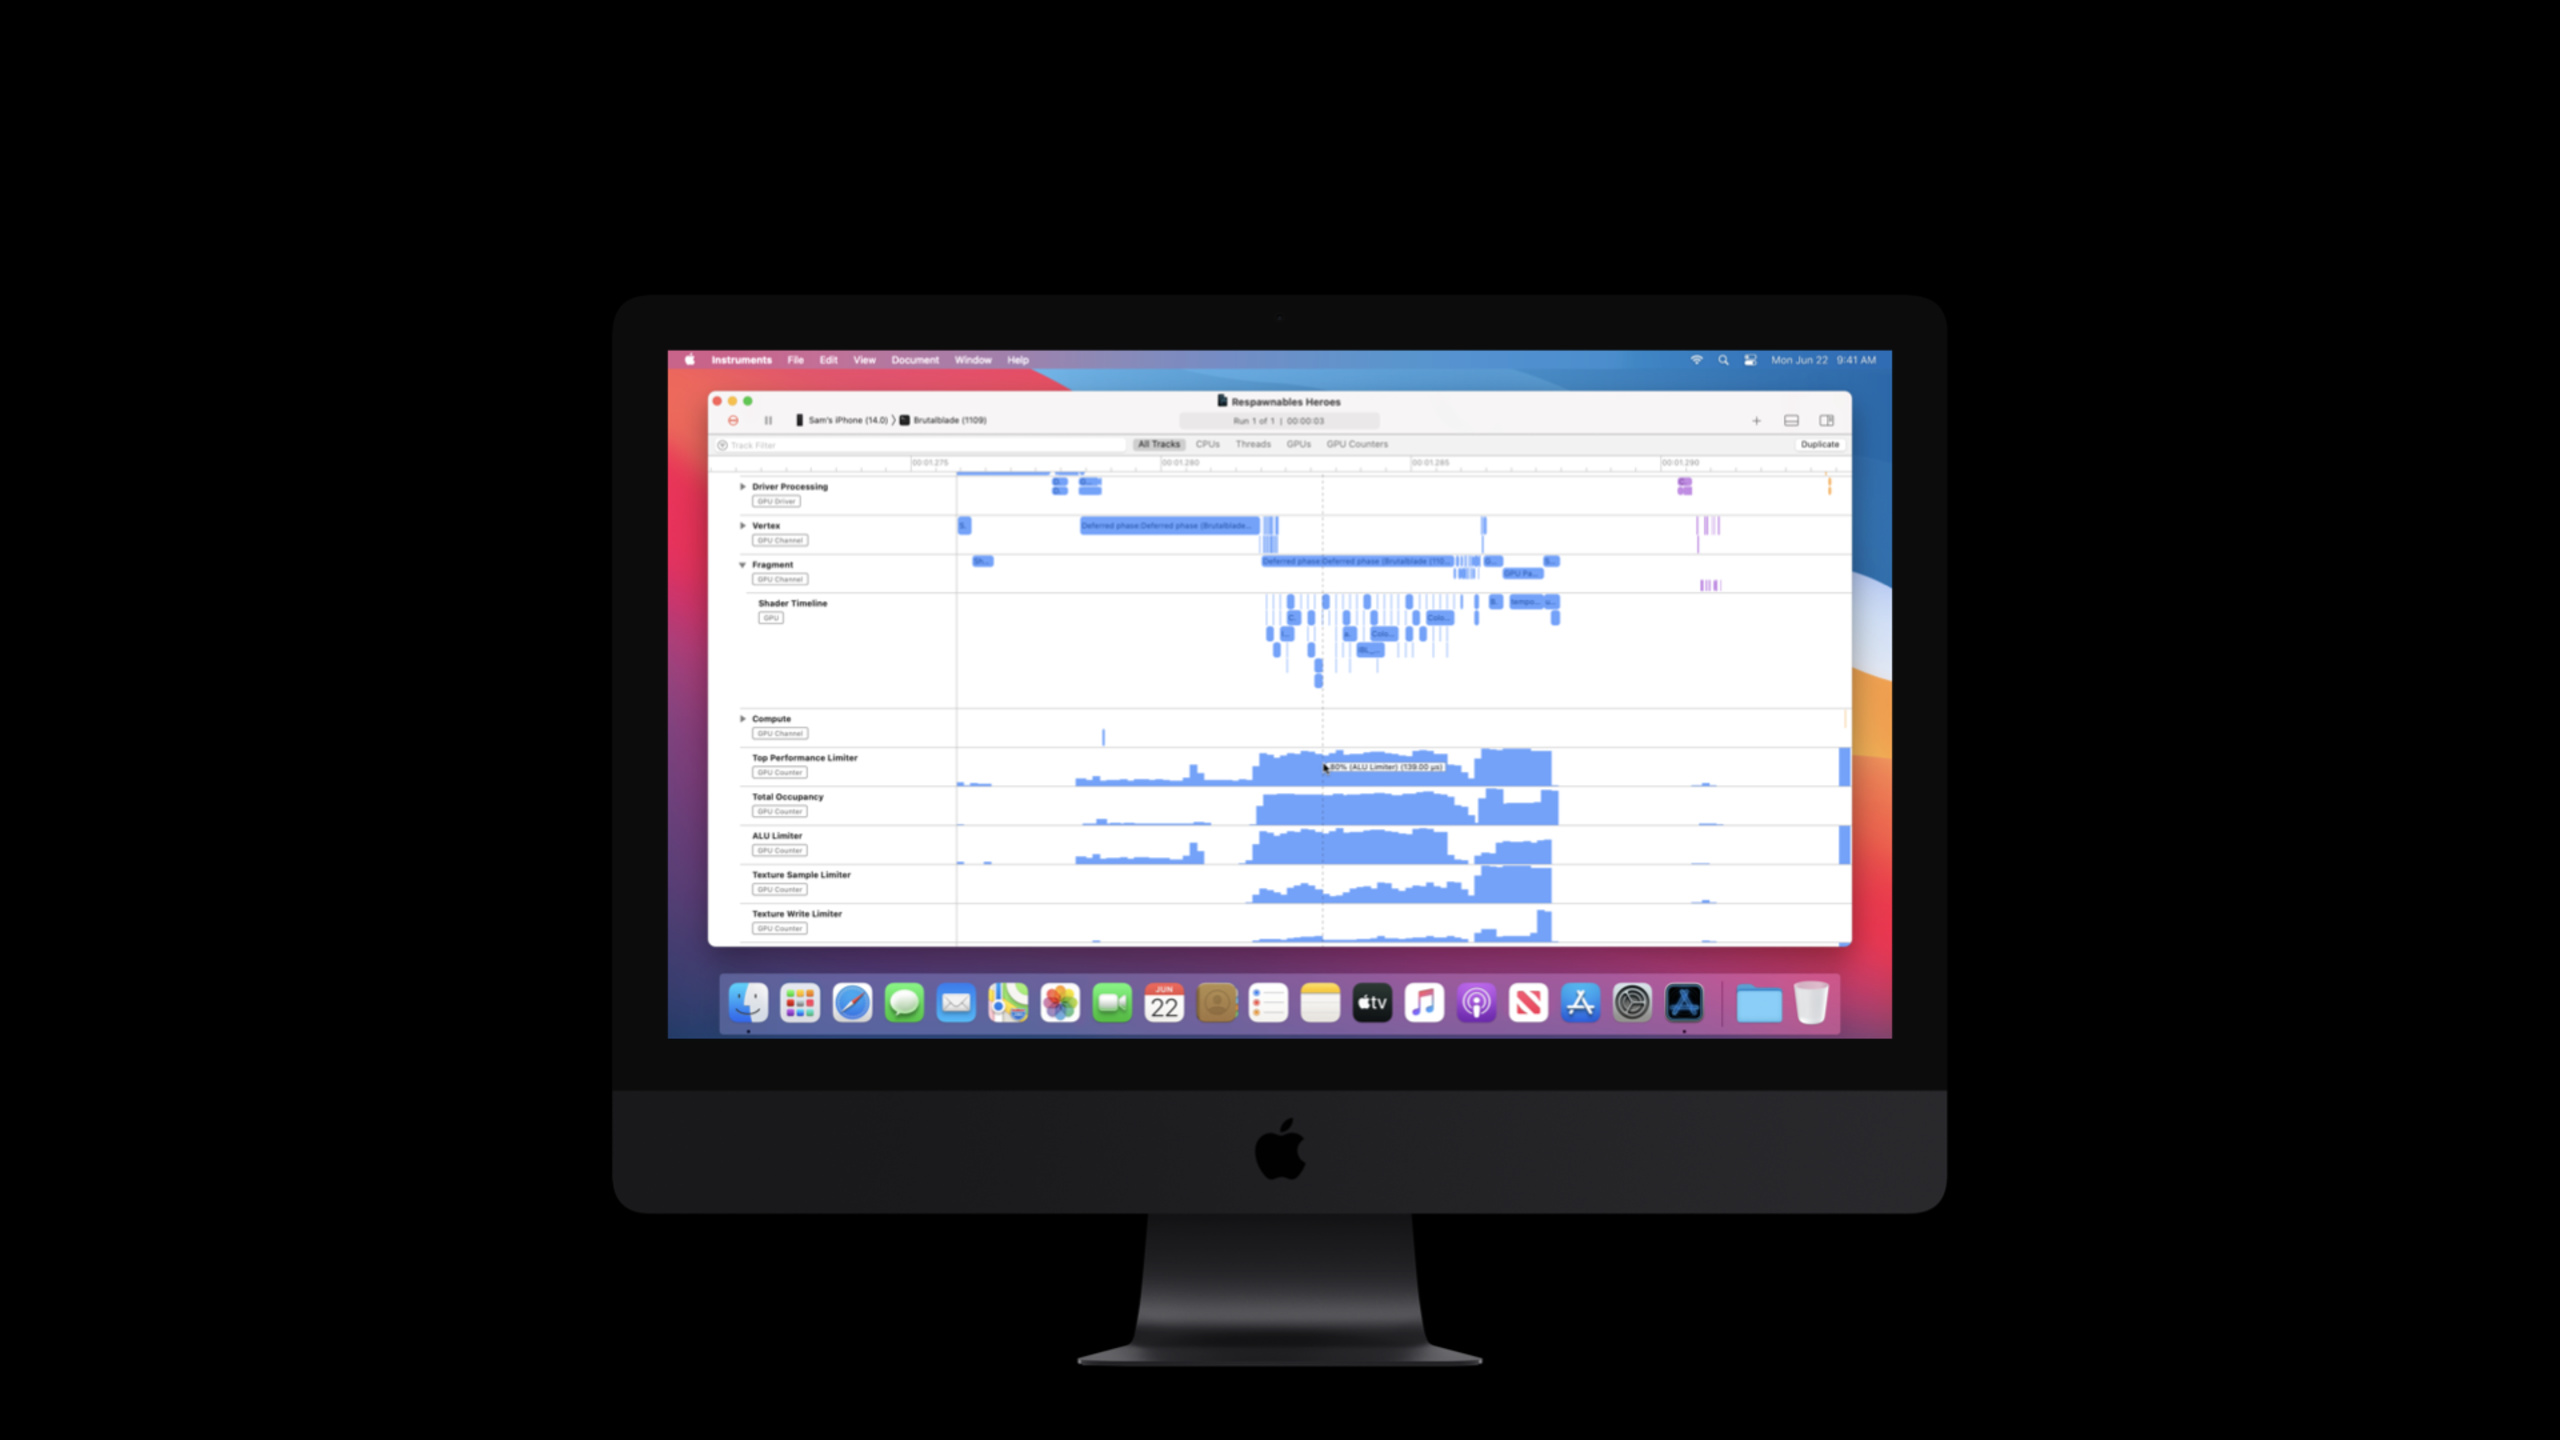
(06:58)demo 的第一步是在 Instruments 里选择 Game Performance template,确认设备和 app,进入 Metal Application recording options,把 GPU Counter Set 设为 Performance Limiters,并启用新的 Shader Timeline。录制完成后,开发者可以缩放到一帧,看 command buffers、encoders 和 shaders 的时间线。
关键点:
- 先看真实设备上的 workload,因为 session 明确提到 Metal System Trace 会受到 thermals 和动态系统变化影响。
- Shader Timeline 可以显示某个 encoder 执行期间哪些 shaders 在运行,以及对应的 sample 数和近似 GPU time。
- demo 中最值得深挖的是 Deferred Phase Encoder,因为它在帧内耗时最长,fragment shader 约 1.29 ms。
- Performance Limiters 的 top track 会显示当前最突出的 limiter,下面还有 ALU、Texture Sampler 等单独 track。
Performance Limiters 给排查排序
(05:58)GPU 同时执行 arithmetic、memory access、rasterization 等任务。Limiter counters 的作用是量化多个子系统的 activity 和 stalls,指出“最慢的那一部分”。演讲者建议总是先看 performance limiters,再决定进入哪一组 counters。
(10:00)这场 session 覆盖的 limiter 包括 Arithmetic、Texture Read and Write、Tile Memory Load and Store、Buffer Read and Write、GPU Last Level Cache 和 Fragment Input Interpolation。Xcode 里可以按 group 查看,也可以用过滤器输入 ALU、Texture、Buffer、Imageblock 或 Last Level Cache 来收窄列表。
关键点:
- top limiter 不是最终答案,只是下一步调查的入口。
- Instruments 适合找“哪一段最久”,Xcode 适合回答“为什么这一段久”。
- Xcode 的 counters table 可以排序,demo 用它找出最 expensive encoder 和最受 ALU 限制的 encoder。
- 对一个 encoder 的平均判断不够时,可以切到 Per-Draw Counters mode,把问题缩小到具体 draw call。
ALU limiter:检查精度、复杂运算和分支一致性
(10:22)ALU 是 shader core 的一部分,处理 floating-point arithmetic、integer arithmetic、bit-wise operation 和 relational operation。Apple GPU 上,16-bit floating point 以 double rate 运行,32-bit floating point 以 full rate 运行,32-bit integer 和 complex operation 通常只有 half rate 或更低。
(11:19)shader core 的 SIMD lane 有 32 个 threads,但共享一个 program counter。所有 threads 执行同一条指令时,属于 coherent execution。条件分支让部分 threads 走另一条路径时,属于 divergent execution;demo 图里同一段程序从 40 cycles 变成 70 cycles,因为未进入分支的 threads 仍然要消耗 cycles。
关键点:
- 如果 ALU limiter 很高,先确认它是不是期望中的瓶颈;GPU crunching numbers 本身并不是坏事。
- 想减少 ALU load 时,session 建议把复杂计算替换成 approximations 或 lookup tables。
- 能用 half precision 时减少 full precision floats,避免 implicit conversions 和 FP32 textures/buffers 输入。
- 项目允许时,确认 Metal shaders 使用
-ffast-math编译选项。 - 高 ALU limiter 不代表 shader 高效;演讲者举例说,全是 FP32 operation 时,可能 100% ALU limited,但 utilization 只有 50%。
Texture 和 bandwidth:从格式、压缩、storage mode 查起
(14:25)Texture Processing Unit(TPU,纹理处理单元)负责读取 texture data。它用于 render pass 的 LoadActionLoad,也用于 shader 里显式读取或采样 texture。Pixel format 会直接影响 sampling rate,演讲中特别点名 RGBA32Float 这类 128-bit format,因为它们按 quarter rate 采样。
(15:10)Apple GPU 支持 PVRTC、ASTC 这类 block-compressed pixel formats,也支持 conventional pixel formats 的 lossless compression。A13 GPU 支持 ASTC HDR;演讲中的 HDR environment map 例子显示,未压缩的小 cube map 需要 3 MB,ASTC HDR 可以明显降低 memory footprint 和 bandwidth。
(29:50)Xcode demo 展示了完整排查链路:切到 Memory group,按 Bytes Read From Main Memory 排序,确认 Deferred Phase encoder 读内存最多;切换到 Per-Draw Counters mode,只看该 encoder 内的 draw calls;再按 texture L1 bytes transferred 排序,进入 Bound Resources,发现 draw call 绑定并读取 shared storage 的 RGBA16 floating-point cube map。
关键点:
- Texture Sample limiter 高时,优先检查 mipmaps、filtering options、anisotropic sample count、pixel size 和 texture compression。
- Texture Write limiter 高时,检查 pixel size、unique MSAA samples per pixel,以及写入是否 coherent。
- shared storage 的 sampled texture 无法自动使用 lossless texture compression;demo 建议改为 private storage。
- private storage 不可用时,可以用 Blit Command Encoder 显式为 GPU 优化资源。
- Memory Bandwidth counter 衡量 System Memory 到 GPU 的数据传输;如果 texture 或 buffer limiter 同时很高,要先优化对应资源。
Tile Memory、Buffer、GPU LLC:把数据放在合适层级
(17:34)Tile Memory 是高性能内存,用来存 Threadgroup 和 Imageblock data。它会出现在 tile shaders、threadgroup memory、render pass color attachments、programmable blending 和普通 blending 等场景里。工具和文档里常把 Tile Memory 显示为 Imageblock 或 Threadgroup Memory。
关键点:
- Tile Memory limiter 高时,session 建议减少 threadgroup atomics。
- 算法允许时,可以考虑 threadgroup parallel reductions 或 SIMD lane operations。
- threadgroup memory allocations 和 accesses 要对齐到 16 bytes。
- memory access pattern 本身也会影响效率,可以通过重排访问顺序改善。
(18:52)Metal buffers 也 backed by Device Memory,但只由 Shader Core 访问。buffer data 有 device 和 constant 两种 address spaces:device 适合按 fragment 或 vertex 索引访问的数据;constant 适合被许多 vertices 或 fragments 共同使用的 read-only data。
关键点:
- Buffer limiter 高时,先检查数据是否能 pack 得更紧。
- 使用 smaller types,减少不必要的数据宽度。
- 尽量 vectorize load and store。
- 避免 device atomics 和 register spills。
- 某些场景可以把数据改用 texture,以利用 ALU 与 TPU 不同的 cache。
(20:08)GPU Last Level Cache(GPU LLC)由所有 GPU cores 共享,缓存 texture 和 buffer data,也会存 device atomics。它为 spatial locality 和 temporal locality 优化。session 建议优先使用 Tile Memory,而不是让 GPU LLC 承担过多压力;如果 texture 或 buffer limiters 同时高,就先处理 texture 或 buffer。
Occupancy 和 HSR 要和其他 counters 联读
(23:24)Occupancy 衡量 GPU 当前使用了多少 thread capacity。GPU 通过切换 available threads 来隐藏 latency,前提是内部资源足够,且有 commands 可以调度。演讲者强调,高 occupancy 或低 occupancy 本身都不等于问题。
关键点:
- 开发者应该查询 compute 或 rendering pipeline 的 static properties,包括 maximum number of threads per threadgroup、SIMD lane execution width,以及 static threadgroup memory length。
- Low Vertex Occupancy 可以接受,只要有足够的 Fragment Occupancy。
- Low overall occupancy 可能来自 tile/threadgroup memory 等内部资源耗尽,也可能只是 render area 太小或 compute grids 太小。
- Occupancy 要和 ALU、Texture、Buffer、Bandwidth 等 counters 一起判断。
(25:54)HSR(Hidden Surface Removal,隐藏面移除)是 early visibility pass,用来减少 overdraw。它对 opaque meshes 是 pixel perfect,并且 submission order independent。session 用一个可测指标定义 overdraw:Fragment Shader invocations 与 Pixels Stored 的比值。
关键点:
- HSR 的效率可以用 pixels rasterized、Fragment Shader invocations、pixels stored 和 Pre-Z test fails 等 counters 衡量。
- 降低 overdraw 时,可以减少 full-screen passes 和 blending。
- draw order 应该按 visibility state 排序:先 opaque meshes,再 alpha test、discard、depth feedback,最后 translucent meshes。
- 避免把 opaque 和 non-opaque meshes 交错提交。
- 避免把 color attachment write masks 不同的 opaque meshes 交错提交。
核心启发
-
做什么:给游戏内置一个“性能场景”菜单,固定跳转到战斗、主城、后处理压力测试等可复现画面。
- 为什么值得做:session 的工作流从真实 frame 开始,固定场景能让 Instruments 和 Xcode 捕获可比较的 counters。
- 怎么开始:为每个场景加调试入口,录制 Metal System Trace,先比较 top performance limiter 和最长 encoder。
-
做什么:为材质系统增加“纹理带宽审计”报表。
- 为什么值得做:demo 通过 per-draw counters 找到 shared storage 的 RGBA16 floating-point cube map,并建议改为 private storage 或 block compression。
- 怎么开始:扫描 texture 的 pixel format、mipmap、storageMode 和 compression 状态,把 RGBA32Float、无 mipmap、shared sampled texture 标为高优先级检查项。
-
做什么:在 shader review 中加入 half precision 和 divergent branch 检查。
- 为什么值得做:session 明确说明 F16 是 double rate,divergent execution 会让同一个 SIMD lane 付出额外 cycles。
- 怎么开始:从 ALU limiter 最高的 encoder 开始,审查 fragment shader 中的 FP32 输入、复杂函数、隐式转换和数据相关分支。
-
做什么:为透明物体、alpha test、opaque mesh 建立稳定的 draw order 策略。
- 为什么值得做:HSR counters 可以衡量 overdraw;session 建议先 opaque,再 alpha/discard/depth feedback,最后 translucent。
- 怎么开始:在 renderer 的 render queue 中按 visibility state 分桶,再用 Fragment Shader invocations 与 Pixels Stored 的比值验证改动。
关联 Session
- Harness Apple GPUs with Metal — 补齐 TBDR、tile memory、render pass 等架构背景。
- Bring your Metal app to Apple silicon Macs — 解释 Apple silicon Mac 上的 GPU 架构迁移重点。
- Optimize Metal Performance for Apple silicon Macs — 继续讲 Metal workload 在 Apple silicon Mac 上的性能调优。
- Gain insights into your Metal app with Xcode 12 — 介绍 Xcode 12 中用于理解 Metal app 行为的调试工具。
评论
GitHub Issues · utterances